Solana Faces Critical Test at $135 Support as New ETF Launches and Technical Signals Clash
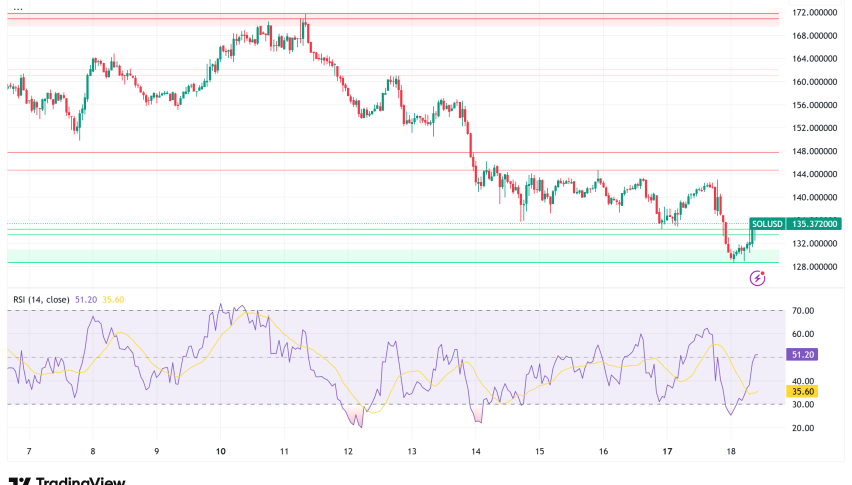
Solana (SOL) is going through one of its most important times of 2025 right now. The price is about $135, down more than 3% in the last 24 h
Quick overview
- Solana's price is currently around $135, down over 3% in the last 24 hours, as it faces a critical decision zone for traders.
- The launch of VanEck's Solana ETF marks a significant increase in institutional access, with strong inflows despite recent price declines.
- Technical analysis indicates that Solana is at a make-or-break support zone between $134 and $140, with potential for a bounce or a significant drop.
- On-chain data shows whale accumulation, suggesting that buying pressure may be increasing despite the overall downward trend.
Solana SOL/USD is going through one of its most important times of 2025 right now. The price is about $135, down more than 3% in the last 24 hours. The most popular smart contract platform is at a crucial point when bullish technical indications are appearing, but the price structure is still weak. This makes it a high-stakes decision zone for traders.
VanEck Solana ETF Launch Marks Growing Institutional Access
Even though the price has been going down lately, the institutional environment for Solana keeps getting bigger. VanEck’s Solana ETF (VSOL) started trading on Monday. It is the third U.S. fund to offer SOL staking yields, after Bitwise and Grayscale’s products, which have brought in more than $380 million in inflows. The new fund is waiving its 0.3% management charge until February 17 or until it has $1 billion in assets. This makes the competition in the space even stronger.
Fidelity’s Solana ETF (FSOL) is set to start on Tuesday. Bloomberg analyst Eric Balchunas thinks Grayscale’s Dogecoin ETF will start as soon as November 24. The SEC changed its policy in September to facilitate faster approvals without having to look at each fund individually. This led to a wave of cryptocurrency ETF debuts.
It’s important to note that institutional demand for SOL has stayed strong even during the recent slump. On Monday alone, Solana ETFs saw $8.25 million in net inflows. This was the 15th day in a row that they saw positive flows, even though the token has dropped more than 30% from its late October peak of around $210-$220.
SOL/USD Technical Analysis Reveals Make-or-Break Support Zone
Solana has hit a new five-month bottom and is now sitting on a support band that has been tested a lot between $134 and $140. The multi-month chart shows a definite pattern of lower highs and lower lows since the top in October. The price is now well below its 200-day simple moving average, and the volume is getting thinner, which usually means that fewer buyers are participating.
Henry, a technical analyst, says that this level is a real pivot point because repeated testing reveal that absorption is getting weaker, but the zone hasn’t broken. Two different things might happen: if buyers protect the support, SOL could bounce back toward $165–$175, which is where the next significant supply zone is. But if it breaks down, the price might drop quickly to $120, $105, or even $98.
Bullish Divergences Signal Potential Reversal
Even though the price is going down, lower timeframe analysis is showing some positive signs that the trend is going the other way. Crypto expert Umair has found double bullish divergences building on both the 4-hour and daily RSI indicators. This means that bearish momentum may be waning, even though the price is still challenging support.
Also, a new TD Sequential “1” buy signal has formed at the $138-$142 zone. This usually means that the market is about to run out of steam after a long period of selling. The group of small-bodied candles in this location supports the idea that the downward momentum is slowing down.
The Relative Strength Index is at 30 on the daily chart, which is close to the point where it is too low. This means that there is more selling pressure, but historically, extreme oversold situations come before reversals when investors start buying at what they think are low prices.
On-Chain Data Shows SOL Whale Accumulation
Data from CryptoQuant shows positive changes in the structure of the market. The average order size in SOL’s spot market shows that big whale buyers are buying a lot during the downturn. The Cumulative Volume Delta demonstrates that there are more purchase orders than sell orders, which suggests that the buy side is becoming more powerful.
At the same time, the volume bubble map that tracks both the spot and futures markets shows that trading is going down. When the volume goes down during a slump, it usually means that there is less selling pressure, which could lead to a rebound later on.
Solana Price Prediction: Critical Decision Ahead
At the moment, Solana is above the S2 Pivot Point at $128, which is quite close to the important $126 support level set by the June 22 low. This coming together of solid support levels could soak up new supply and cause a bounce.
If support holds, analysts think SOL might push the $150 level and maybe even reach the $155 supply zone. If the current levels hold and the bullish divergences support this, momentum might turn toward $160 and higher.
But if the price closes below $134, the reversal setup will be invalidated, and the price will probably drop quickly to $120. If the price fails to stay above $126, it might drop much deeper to the April 7 low of $95.
- Check out our free forex signals
- Follow the top economic events on FX Leaders economic calendar
- Trade better, discover more Forex Trading Strategies
- Open a FREE Trading Account
- Read our latest reviews on: Avatrade, Exness, HFM and XM
Related Articles


Sidebar rates
Related Posts
