Solana (SOL) Long-Term Holders Exit as $143 Resistance Looms
Solana (SOL) is trying to make a short-term recovery, trading over $142 with a 2% gain in 24 hours. However, this bounce confronts strong
Quick overview
- Solana (SOL) is attempting a short-term recovery, trading above $142 with a 2% gain in the last 24 hours.
- Long-term holders are selling into the rise, indicating a lack of confidence in the price reversal.
- For a sustained upward trend, Solana must close above the critical resistance level of $143 daily.
- Failure to maintain this level could lead to a decline towards the $128 support zone.
Solana SOL/USD is trying to make a short-term recovery, trading over $142 with a 2% gain in 24 hours. However, this bounce confronts strong headwinds from long-term holders and important technical barriers. On-chain data shows that experienced investors are selling into the rise, which lowers their supply exposure and shows that they don’t believe the reversal story. To confirm any long-term upward momentum, the market must close above the important resistance level of $143 every day. If it doesn’t, the market could drop much further to $128.
On-Chain Caution: Long-Term Holders Dump Supply
Even though the price went up recently, the way that Solana’s holders are set up implies that the rally doesn’t have support from institutions or veterans, which makes me worry how long it will last.
The HODL Wave Distribution
Analysis of HODL Waves shows that the 1- to 2-year holder group has cut its supply share by a lot, going from 19.28% to 17.24% in the last month. This drop is important since this age group usually stays the same or grows when the market really turns around. Even with the 4% daily rebound, the consistent selling shows that long-term holders don’t see the recent price movement as a real trend shift. Instead, they are choosing to lower their risk after a month-long decline that saw SOL drop nearly 22%.
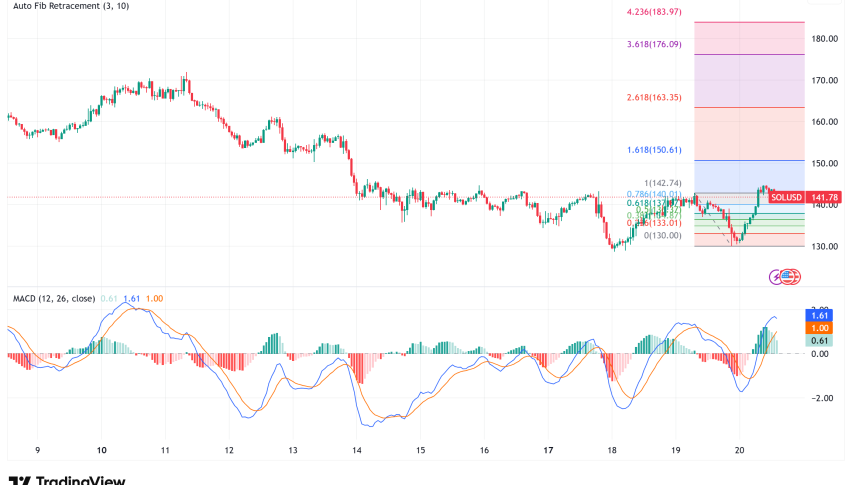
SOL/USD Technical Analysis: $143 is the Pivot
Solana’s upward momentum is colliding directly with a heavy supply cluster and a weakening moving average setup, setting up a make-or-break technical moment.
EMA and Supply Resistance
The short-term rally has driven SOL right into a zone of substantial overhead supply between $140 and $142, where two major cost-basis clusters together contain more than 33 million SOL. People that bought at these levels will probably sell when the price goes back down, which will end the surge.
- Important Pivot Point: The price of Solana needs to close cleanly above $143 every day in order to absorb this supply and show real strength.
- Bearish Crossover: Adding to the pressure is the technical concern that the 100-day EMA will cross below the 200-day EMA, a classic “death cross” configuration that usually means a trend is about to stop and more drops will follow.
Short-Term Recovery Levels
Even though there has been a lot of caution in the long term, SOL has broken above a significant bearish trend line with resistance around $140 on the hourly chart. The Hourly MACD is also gaining speed in the bullish zone. There are still problems that need to be solved right away:
- Immediate Resistance: $145 and major resistance at $150.
- Next Key Hurdle: A strong move would target $155, which coincides with the 61.8% Fibonacci retracement of the move from the $172 swing high to the $129 low.
Solana Price Prediction: $155 or $128 Define the Short-Term
Solana is at a really important point right now. Institutions are buying a lot of it, and the recent introduction of the 21 Shares Solana ETF (TSOL) is having trouble because of bearish holder behavior and technical structure.
- Bullish Scenario (Breakout): A daily close over $143 is the most important sign that this is true. This would make it possible to get to $155 and maybe even $167, which might break the long-term slump. If the price goes over $167, the bigger downturn will slow down and goals like $189 will come back into view.
- Bearish Scenario (Breakdown): If SOL doesn’t break through $143 and closes back below $138 support, the rally will probably fade. If it fails, it would show weakness, and the next big negative target would be the $128 support zone, which was a prior low. If the price closes below $128, it would be a bad sign that the price could drop faster toward $120.
The market’s patience is running out. In the next 24 to 48 hours, we’ll find out if Solana can take advantage of the short-term technical bounce or if long-term holders were right to be cautious.
- Check out our free forex signals
- Follow the top economic events on FX Leaders economic calendar
- Trade better, discover more Forex Trading Strategies
- Open a FREE Trading Account
- Read our latest reviews on: Avatrade, Exness, HFM and XM
Related Articles


Sidebar rates
Related Posts
