Solana ETF Inflows Surge Despite 7% Daily Decline, Technical Signals Point to Critical Crossroads
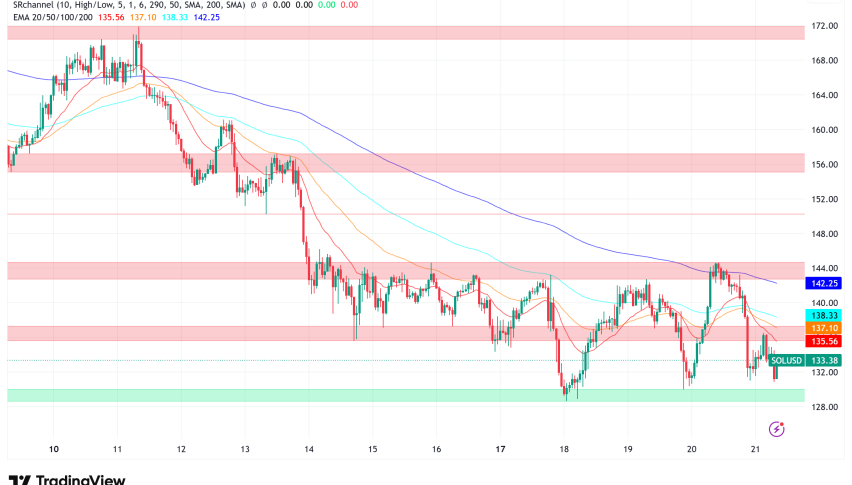
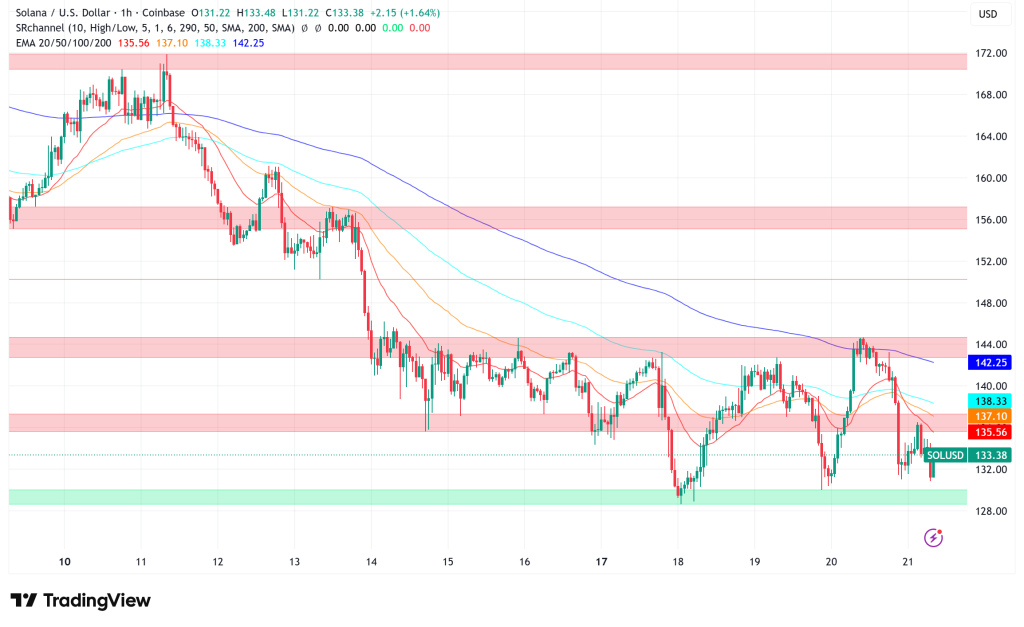
Solana (SOL) is having a rough time at $132, down more than 7% in the last 24 hours. This is because the cryptocurrency is dealing with
Quick overview
- Solana's price has dropped over 7% in the last 24 hours, currently sitting at $132 amid conflicting market signals.
- Despite a significant $476 million in net inflows from newly minted spot ETFs, futures market data indicates traders are preparing for further losses.
- Technical analysis shows a struggle between bullish reversal patterns and bearish resistance at the $140 level, with potential downside targets at $120.
- Solana's fundamental strength remains robust, with increasing on-chain activity and institutional interest providing medium-term support.
Solana SOL/USD is having a rough time at $132, down more than 7% in the last 24 hours. This is because the cryptocurrency is dealing with conflicting signals from institutional capital flows and technical selling pressure. Even while newly minted spot ETFs have had an amazing 17-day inflow streak, data from the futures market shows that traders are getting ready for more losses. This is a very important turning moment for the fifth-largest cryptocurrency by market value.
Record Solana ETF Inflows Clash With Deteriorating Market Structure
The difference between institutional interest and market weakness has never more clearer. Since they first came out, Solana spot ETFs have brought in a huge $476 million in net inflows. Bitwise’s BSOL fund has the most assets, with $424 million, making up 89% of the total value. BSOL got $35 million in new capital on November 19 alone. This was its third-highest daily inflow and its largest since early November.
Even though SOL’s price has dropped about 30% from $186 to around $130 now, this institutional interest is still there. According to ETF expert Eric Balchunas, the 21Shares Solana ETF started with $100 million in assets under management, which helped the SOL ETF group raise a total of $2 billion in cash. It’s amazing that these products have been getting money “basically every day,” even while the rest of the market is going through what Balchunas called “extreme fear.”
But the price action suggests a different narrative. Futures data shows that aggregated open interest stayed the same or went down a little during SOL’s effort to rally from $130 to $140, which means that not many new long positions were opened. More troubling, open interest rose sharply when the price settled around $140, which means that new positions, probably negative ones, were building up resistance. The cumulative volume delta dropped dramatically during the decline in both the futures and spot markets. This showed that there was a steady net selling pressure from many different types of participants.
SOL/USD Technical Analysis: Bulls and Bears Draw Battle Lines
There are two conflicting stories in the technical picture. On the bearish side, Solana did better than Bitcoin BTC/USD, Ethereum ETH/USD, and XRP XRP/USD for a short time on Thursday, with higher-high and higher-low structures on shorter timeframes. However, it was turned down at the 50-period exponential moving average near $140. Even though the price dropped to $130, high financing rates signal that leveraged long positions are still crowded and at risk of liquidation cascades.
Analysts say that if the $140 resistance level isn’t quickly reclaimed, the next logical objective is $120, where liquidity and a daily order block meet. A traditional setup for more downside is when funding rates are high and prices don’t stay above important technical levels. Sellers are still in charge of short-term price movement.
On the other hand, bullish experts point to new reversal patterns that are showing up on a number of timeframes. Trader Cobb pointed out that Solana was the first big asset to get back to its 4-hour trend level, breaking through resistance near $143-$145 with clean candle expansion and tight wicks. In the past, when SOL reclaims the 4-hour structure before its contemporaries, it usually leads the next rotation leg higher.
GTradeCrypto found a perfect double-bottom pattern between $131 and $133, with both lows backed up by oversold RSI readings. The measured move target for this pattern indicates to $160, which is the upper limit of a descending channel that has now been broken to the upside. Some chartists even think that a cup-and-handle pattern is forming on weekly timeframes, and the important $128-$180 area has stayed the same even if things have been volatile lately.
Fundamental Strength Provides Medium-Term Support
Solana’s basic position keeps getting stronger, even while the price is going down. The network is still number one in both application revenue and decentralized exchange volume, and it has been up for more than 650 days straight. For the first time, on-chain SOL/USDC volume just surpassed that of all centralized exchanges combined. This is a big deal since it shows that people are changing their behavior and choosing Solana’s low-fee, high-speed environment more and more.
The solidity of this infrastructure, along with the adoption of ETFs by large institutions like Fidelity, VanEck, Canary, and 21Shares, makes a foundation that could limit losses even if short-term technical harm continues.
Solana Price Outlook: $120 Retest or $160 Breakout?
The cryptocurrency is at a very important point. Bears say that if the price doesn’t get back above $140, momentum will keep falling toward the $120 support zone, where demand was strong before. This cautious approach is backed up by the fact that open interest stays level during rallies, spikes near resistance, volume delta goes down, and financing rates go up.
Bulls say that the early 4-hour trend recapture, double-bottom confirmation, and record on-chain activity show that a long-term recovery phase is starting. If current support holds and buyers protect the $130–$135 level, the technical path to $160 becomes more likely. In a broader recovery scenario, it may even go up to $180.
- Check out our free forex signals
- Follow the top economic events on FX Leaders economic calendar
- Trade better, discover more Forex Trading Strategies
- Open a FREE Trading Account
- Read our latest reviews on: Avatrade, Exness, HFM and XM
Related Articles

Sidebar rates
Related Posts
