Ethereum Holds $2,800 as Bulls Battle Critical Resistance Levels
Ethereum (ETH) is currently trading at about $2,800. It has been relatively stable over the past 24 hours following a week of ups and downs

Quick overview
- Ethereum is currently trading around $2,800, showing signs of a timid recovery after a significant drop of over 18% last week.
- The cryptocurrency faces multiple resistance levels, with $2,890 being a critical barrier that could determine its upward momentum.
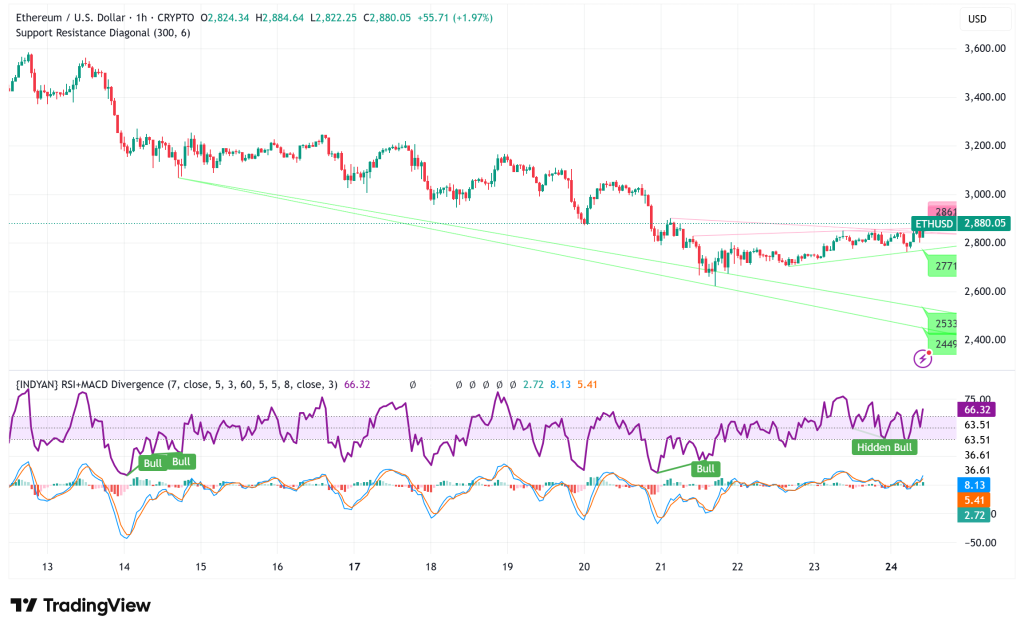
- Technical indicators present mixed signals, with the MACD indicating ongoing selling pressure while the RSI suggests a potential end to the downtrend.
- The upcoming days are crucial for Ethereum, as breaking above $2,960 could lead to higher targets, while failure to do so may result in a retest of lower support levels.
Ethereum ETH/USD is currently trading at about $2,800. It has been relatively stable over the past 24 hours following a week of ups and downs that saw the second-largest cryptocurrency lose more than 18%. The price activity right now implies that a timid recovery is happening, but technical indicators show that there are a few significant hurdles that could decide whether ETH continues to rise or falls again.
ETH/USD Technical Analysis: Multiple Resistance Zones Ahead
Ethereum’s latest price movement shows that momentum is not working. After failing to break through a trendline that had already been broken on November 13, ETH fell from around $3,058 to a low of $2,621 on Friday, which was a big drop from recent highs. The cryptocurrency gained temporary support near the $2,749 level, which is the 61.8% Fibonacci retracement level. This is a technically important area that has helped the current recovery attempt.
Ethereum is currently trading close to the 100-hourly Simple Moving Average around $2,840. Its first big test will be at the $2,890 resistance level, which is also the 61.8% Fibonacci retracement of the previous drop. If bulls break over this barrier, the focus will move to $2,920 and then the important $2,950 zone.
The most crucial thing is that a negative trend line has developed on the hourly chart, with resistance at $2,960. This level is very important because if the price breaks above it, it might go up to $3,020, and then it could go even higher to $3,120 or even $3,250 in the near future.
Downside Risks Remain
But if the price doesn’t break over the $2,890 resistance, selling pressure could start up again. At $2,800, there is the first line of defense, and at $2,720, there is considerable assistance. If ETH breaks below $2,720, it would be quite bearish and could take ETH back below the current low of about $2,620, with more support levels at $2,550 and $2,500.
MACD, RSI Indicators Signal Mixed Messages
The hourly MACD keeps losing momentum in bearish territory, which means that selling pressure hasn’t completely gone away. The RSI has risen back above the 50 mark and is bouncing back from being oversold, which is a good indication. This is similar to what happened with Bitcoin recently and might mean that the downtrend is coming to an end and that accumulation is starting to happen.
Ethereum Price Prediction: Critical Week Ahead
The next few days will be very important for Ethereum’s medium-term path. Bulls need to clearly take back the $2,960 resistance level and the daily resistance level at $3,017 in order to break the bearish structure and aim for $3,250. On the other hand, if bears keep control below $2,890, ETH might try support at $2,749 again, with $2,620 being the last line in the sand.
The current technical setup makes it look like ETH might slowly rise toward $3,000-$3,020 if purchasing momentum keeps up. However, traders should keep a close eye on the $2,720 support level as an indication that the price is going to break down.
- Check out our free forex signals
- Follow the top economic events on FX Leaders economic calendar
- Trade better, discover more Forex Trading Strategies
- Open a FREE Trading Account
- Read our latest reviews on: Avatrade, Exness, HFM and XM
Related Articles


Sidebar rates
Related Posts
