BNB Chain Eyes $1,000 Breakout as Triple Bullish Signals Converge in December Rally
BNB Chain (BNB) is showing strong bullish vigor after rising more than 13% from its local bottom near $800. It is now trading above $916, up
Quick overview
- BNB Chain has risen over 13% from its local bottom near $800 and is currently trading above $916.
- A double-bottom pattern on the four-hour chart indicates a potential bullish reversal, with critical resistance around $900-$920.
- Short liquidations worth $112 million at the $1,020 level could catalyze further price increases for BNB.
- For sustained bullish momentum, BNB must hold above the $900-$920 resistance, while the $860 support level remains crucial.
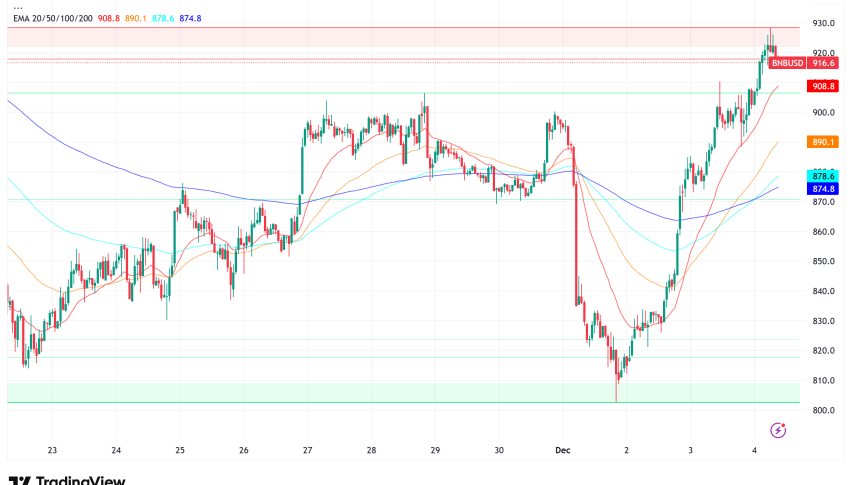
BNB Chain BNB/USD is showing strong bullish vigor after rising more than 13% from its local bottom near $800. It is now trading above $916, up 3.2% in the last 24 hours. The cryptocurrency is currently looking to get back to the psychologically important $1,000 level, thanks to a number of technical signs that suggest December could be a key turning point for the market.
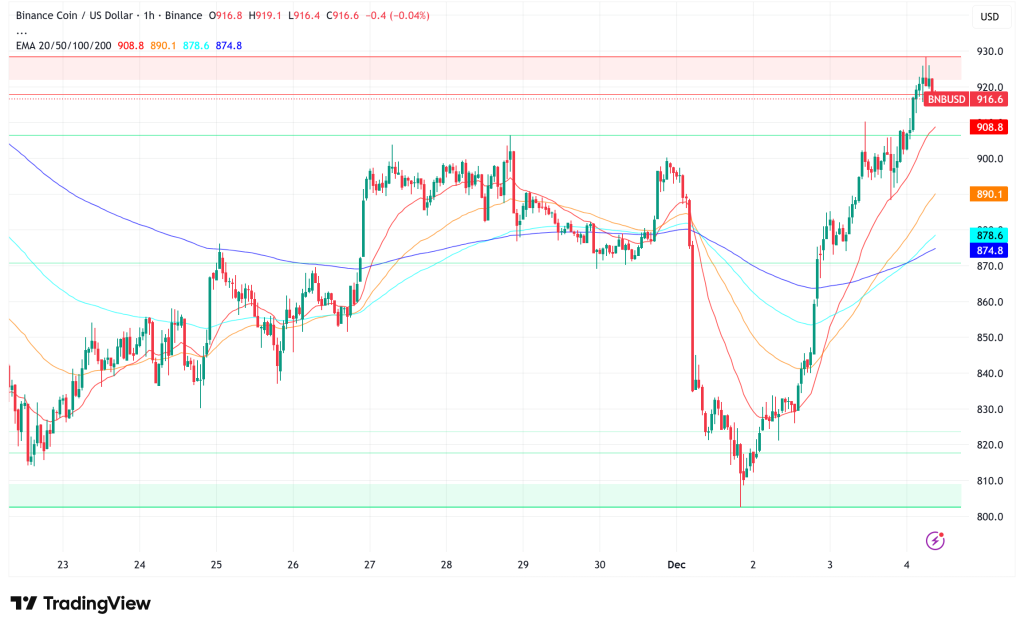
Traders and analysts are paying a lot of attention to the recent market movements as BNB approaches the $900-$920 resistance zone, which is an important neckline for its rising bullish pattern. If the price stays above this level for a long time, it might start a big upward trend. On the other hand, if the price can’t hold on to these gains, it could go back down to lower support levels around $860.
Double Bottom Pattern Signals Potential Trend Reversal
On BNB’s four-hour chart, a classic double-bottom pattern has formed, with two clear lows forming near the $800–$820 demand zone. This typical reversal pattern shows that selling pressure is going down as more and more dip buyers jump in to sustain the price at these levels. The structure shows that bears are losing control after a long drop that lasted most of November.
The neckline resistance of the pattern is now around $900–$920, which is the critical breakout level that might confirm the bullish reversal. Technical analysts say that if BNB breaks out of this range, it might rise to $1,020 in December, which is where the 0.382 Fibonacci retracement level is a reasonable objective. This level is very near to other technical indicators, which makes the case for upside potential even stronger.
But the bullish premise is about to encounter a big test at these levels. If BNB can’t stay above the neckline, the setup will be invalidated, and the price could drop back into the 20-period and 50-period exponential moving averages at approximately $860. This sector is the next important support zone that buyers need to protect in order to keep the recovery going.
$112 Million in Short Liquidations Create Upside Catalyst
CoinGlass’s liquidation data shows that there is a large group of short positions, worth about $112.28 million, clustered around the $1,020 price level on Binance. This large number of pessimistic leveraged bets could start a chain reaction that could speed up BNB’s rise if the recovery keeps on.
When prices move near levels where a lot of short positions are being closed, traders who are betting against the asset have to buy back their positions to reduce their losses. This makes prices go up even faster. This dynamic often acts as a temporary stimulant, pulling prices toward liquidation clusters like a magnet. As riskier assets start to recover more broadly, these short sellers who are stuck could provide BNB the boost it needs to break through barrier levels.
BNB Technical Analysis: Falling Wedge Breakout Points to $1,100+ Upside Target
BNB broke out of a falling wedge pattern that had been going on for weeks in late November, which is another reason to be bullish. This technical structure usually resolves to the upside after long periods of downtrends, and thus far, BNB’s price action has followed the book.
BNB pulled back to test the wedge’s descending upper trendline as support after breaking above it. This is a good sign that the breakout was real. The successful bounce from this retest shows that buyers are taking back control and that what used to be resistance is now working as support.
If the pattern keeps going the way it is supposed to, the measured move from this falling wedge breakout suggests an upside target in the $1,100–$1,115 range. Some experts, like trader CryptoBull_360, have made even more audacious predictions. They say that if momentum keeps building, BNB might rise to $1,300 or more.
BNB Price Outlook: Critical Levels to Watch in December
For BNB to move forward, it has to break through and stay above the $900–$920 neckline resistance. This area is where bulls and bears will fight to decide the asset’s short-term direction. If the price breaks over $920 and stays there for a day, it might lead to more buying interest and possibly reach the upside targets that were spoken about.
On the other hand, if the price moves back below the prior resistance-turned-support zone, it would make the bullish setup much weaker. This might trap breakout traders and hinder any long-term recovery over $1,000. In this case, the $860 support zone would be the most important level for bulls to keep an eye on as they try to protect the comeback.
The technical setup looks better and better for a December rally as the larger BNB Chain ecosystem shows signs of revival, with a $8.3 billion market cap increase and a 4.1% weekly gain. Traders should still be careful, though, and wait for confirmed breakthroughs over major resistance levels before putting money into aggressive bullish positions.
- Check out our free forex signals
- Follow the top economic events on FX Leaders economic calendar
- Trade better, discover more Forex Trading Strategies
- Open a FREE Trading Account
- Read our latest reviews on: Avatrade, Exness, HFM and XM
Related Articles


Sidebar rates
Related Posts
