Bitcoin Battles Historical Odds: Can BTC Break Decade-Long December Bearish Pattern Above $92K?
Bitcoin (BTC) is currently trading above $92,000 and has stayed rather stable over the previous 24 hours as the cryptocurrency reaches a
Quick overview
- Bitcoin is currently trading above $92,000 and aims for a green December, a first in its history after a poor November.
- Historical data shows a 100% correlation of losses from November to December, but analysts believe market conditions in 2025 may break this trend.
- Bitcoin needs to surpass resistance levels around $96,000 to confirm a bullish reversal, with significant liquidations possible if it breaks above $100,000.
- Current macroeconomic factors, including potential Federal Reserve rate cuts, add complexity to Bitcoin's performance amidst a challenging market environment.
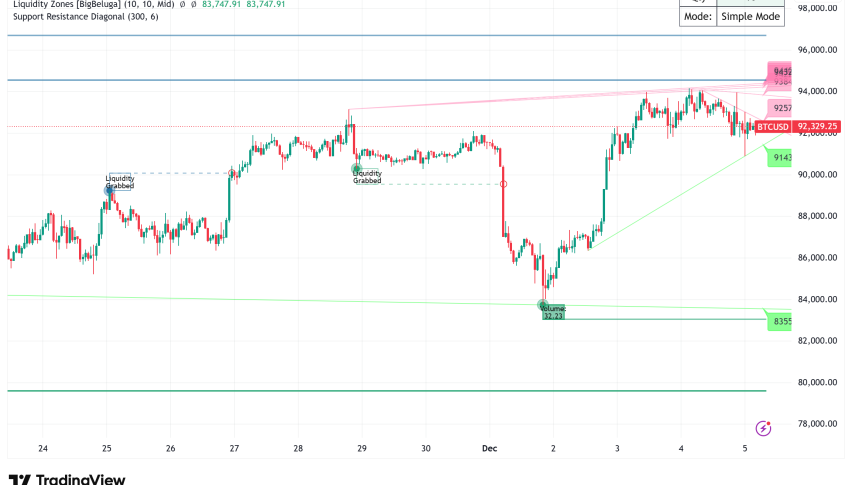
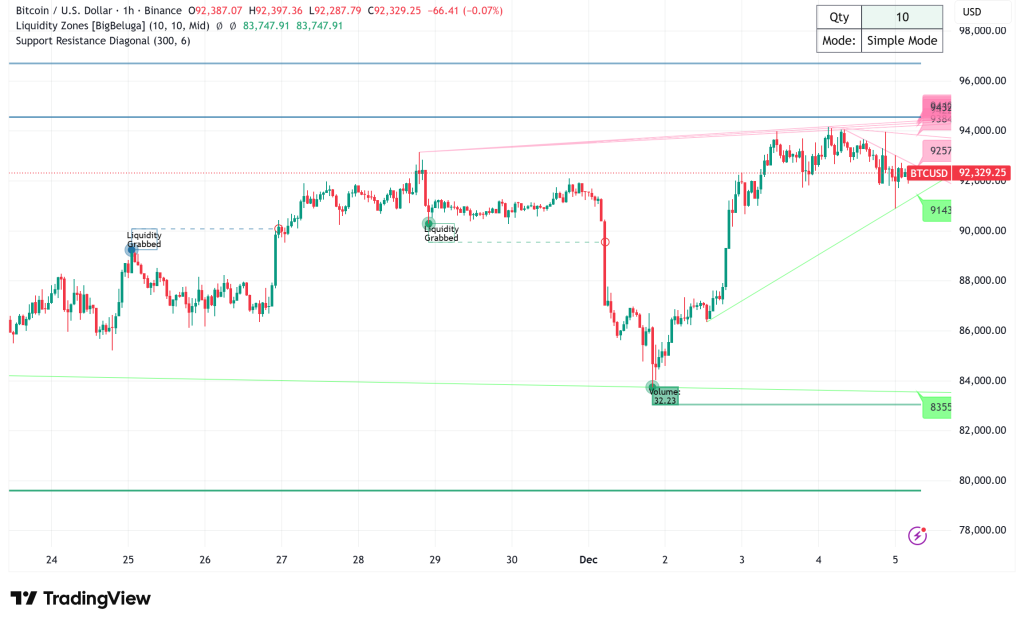
Bitcoin BTC/USD is currently trading above $92,000 and has stayed rather stable over the previous 24 hours as the cryptocurrency reaches a crucial turning point. Bitcoin is trying to have a green December for the first time in its history, after a bad November. This is something it has never done in more than ten years of trade data.
Unprecedented Seasonal Challenge: Breaking the 100% Bearish Streak
According to historical data, there is a worrying pattern: every time November finished with a loss, December followed with a loss as well. This 100% correlation has made it hard for BTC to move forward in the past. Market analysts, on the other hand, say that the structure of the market in 2025 appears very different from prior cycles. Changes in momentum, liquidity, and cycles could be strong enough to break this long-term pattern.
Bitcoin is currently regaining its monthly rolling volume-weighted average price (rVWAP) levels, which means that distribution is under control and the trend is being adopted on higher time frames. Open interest has declined a lot, from $94 billion to $60 billion, which has brought the market back to normal without stopping spot inflows. This makes for a cleaner base for possible continuation.
BTC/USD Technical Analysis: Resistance Clusters and Liquidity Dynamics
From a technical point of view, Bitcoin has to break over a number of resistance levels in order for a positive reversal to be confirmed. The yearly open of $93,500 is still an important key. Some analysts say that BTC’s failure to flip this level is “an indication that the bear thesis remains strong.”
A deep review of liquidity shows that the market has changed its position. In November, there were about $1 billion in downward liquidation clusters near $80,000. Now, there are $3 billion in cumulative short positions that might be liquidated at $96,000, and over $7 billion at danger once BTC gets close to $100,000. This uneven liquidity profile shows that upside momentum could pick up speed quickly if important resistance levels are broken.
Trading site Material Indicators says that Bitcoin needs to break through resistance in the $96,000 to $98,000 level and test the 50-week simple moving average again before we can say for sure that the bull market is back. The current taker buy/sell ratio of about 1.17 shows that people are in a hurry to get into the market, but analysts say this is more likely to be hasty buying than long-term accumulation.
Macroeconomic Crosswinds: Fed Policy and Liquidity Concerns
Bitcoin’s performance in December is happening in the middle of a complicated macroeconomic situation. Even if the US job market is doing well and the number of unemployment claims is lower than expected, the markets think there is an 89% chance that the Federal Reserve will cut rates at the meeting on December 10. The explanation is based on the growing disparity between risky assets that are going up and consumer strength that is going down. Some analysts say that the Fed has “no option” but to decrease rates to help the economy.
But there are some worrying signs that are starting to show up. M2 velocity has leveled off, which could mean that the economy is slowing down even as risk assets are rising. This makes the market act like it does at the end of a market cycle, when the economy gets quieter but the markets get louder.
It’s also interesting to note that cryptocurrencies are doing worse than stocks. The S&P 500 is only 0.5% behind its all-time high, while Bitcoin and altcoins are still having trouble. This difference in performance makes us wonder if crypto can still follow the same trends as other risky assets.
Cycle Evolution: Beyond the Traditional Halving Clock
There may be a big change happening in how the Bitcoin market works. Michaël van de Poppe, an analyst, says that the four-year halving cycle is still there, but it doesn’t fit with time-based expectations as well as it used to. Spot Bitcoin ETF inflows have created a consistent structural bid, which speeds up price discovery and raises Bitcoin’s effective floor relative to past cycles.
Correlations like CNY/USD with ETH/BTC are acting like they usually do at the start of expansionary windows, not around the tops of cycles. This supports this concept. The Purchasing Managers’ Index and other business cycle indicators are slowly getting better as gold’s relative strength rises. This suggests that people’s willingness to take risks is growing again after hitting cyclical lows.
Van de Poppe compares this time to mid-2016 and late-2019, which were both long periods of low liquidity that came before big price jumps. He says, “We’re not even close to a top on Bitcoin, and we’re still in the last easy cycle of crypto with huge returns.” This suggests that the current consolidation looks more like an early-to-mid cycle structure than a topping configuration.
Bitcoin Price Prediction: Critical Levels to Watch
Bearish scenario: If Bitcoin can’t get back above the $93,500 yearly open and loses support at the monthly rVWAP, it will probably have to test the $88,000-$90,000 zone again. If this support level breaks, it might start a chain reaction of liquidations that could bring the price down below $85,000. The November low of about $80,000 would be the last line of defense.
Neutral scenario: the market will continue to consolidate between $90,000 and $95,000 until mid-December, when the Fed’s policy decisions and year-end positioning are fully understood. This trading in a range would fit with the lower liquidity that usually happens during the holidays, which could lead to a big move in early 2025.
Bullish scenario: If there is a confirmed break above $96,000 with steady volume, it might quickly speed up beyond $100,000 as $3–7 billion in short liquidations happen. If December’s first-ever green performance after a red November is successful, it will support the idea that new structural forces, including as ETF inflows, institutional adoption, and changing liquidity dynamics, have fundamentally changed Bitcoin’s old cyclical patterns.
- Check out our free forex signals
- Follow the top economic events on FX Leaders economic calendar
- Trade better, discover more Forex Trading Strategies
- Open a FREE Trading Account
- Read our latest reviews on: Avatrade, Exness, HFM and XM
Related Articles


Sidebar rates
Related Posts
