Bitcoin Holds Above $92,000 as FOMC Decision Looms: Technical Analysis Points to Critical Breakout Zone
Bitcoin (BTC) is currently trading above $92,000, which is a 2.4% increase in the last 24 hours. This is because the markets are getting
Quick overview
- Bitcoin is currently trading above $92,000, marking a 2.4% increase in the last 24 hours as markets anticipate the Federal Reserve's interest rate announcement.
- Despite breaking past the $93,500 resistance, liquidity metrics indicate that the recent price surge may lack strong conviction.
- The upcoming FOMC meeting is crucial, with a 25-basis-point rate cut likely to influence Bitcoin's potential to reach the $100,000 mark.
- On-chain data shows selective accumulation, but high whale ratios suggest that large holders may be preparing to sell rather than buy.
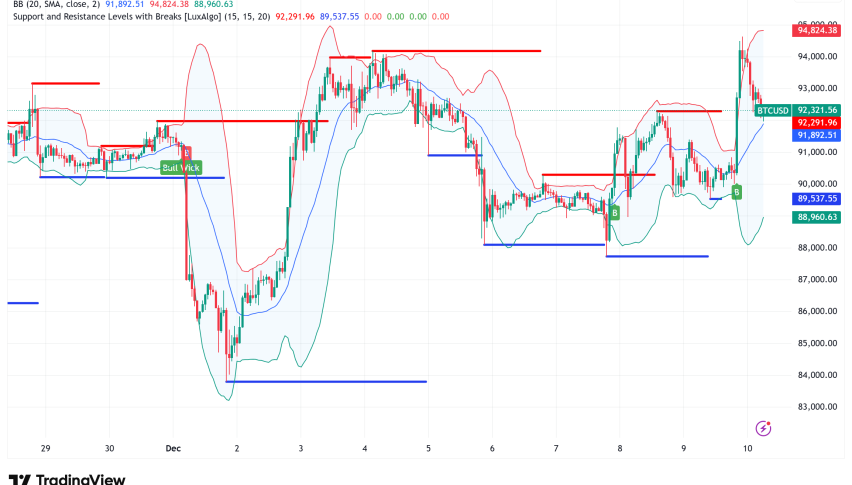
Bitcoin BTC/USD is currently trading above $92,000, which is a 2.4% increase in the last 24 hours. This is because the markets are getting ready for the Federal Reserve’s important interest rate announcement. The top cryptocurrency has recently regained the psychologically critical $94,000 barrier, but underlying liquidity metrics imply that the surge may not have the conviction needed to keep going.
Bulls Recapture $94,000 but Volume Concerns Persist
The price of Bitcoin has broken past the $93,500 resistance mark, which means that the short-term bullish momentum is back after a few days of sideways consolidation. This breakout happens at a very important time, since the rest of the cryptocurrency market is taking a wait-and-see approach before Wednesday’s Federal Open Market Committee (FOMC) meeting.
An 87% chance of a 25-basis-point rate decrease is what the markets are pricing in. This would bring the federal funds rate down to between 3.50% and 3.75%. This would be the third drop in a row this year, and it could be what Bitcoin needs to reach the $100,000 mark.
BTC had already filled the whole fair value gap (FVG) between $87,500 and $90,000 on the four-hour chart, but it was hard to get a follow-up impulse going. The most recent breakout above $93,500 shows that the market is getting stronger again, even though macroeconomic factors are making things more unstable. BTC is still trading close to the monthly volume-weighted average price (VWAP) on both four-hour and one-day periods, though. This means that the market is still in a transitional phase.
Bitcoin’s Liquidity Metrics Flash Warning Signs
Even though Bitcoin’s price is going up, liquidity data shows a more complicated picture. The bid-ask ratio has stayed rather low and unpredictable over the current upswing. The ratio went positive during November’s sharp decrease from $100,000 to $80,000 because big offers took up the sell-off. But the latest comeback hasn’t shown the same aggressive bidding patterns, which means that the increase above $93,500 is mostly due to price changes rather than a lot of new demand.
This dynamic shows that buyers are active in the market, but not in the big, dedicated groups that are common in strong uptrends. For now, the strength of prices seems to be stronger than the strength of depth, which makes people wonder how long the present rise can last.
The Korea Premium Index, which is a major measure of how people feel about shopping, has dropped a lot from its earlier highs. Korean markets, which used to trade at higher prices during rallies earlier this year, are now close to level or slightly negative. This change shows that retail speculators aren’t yet following the current price movement.
On the other hand, the Coinbase Premium Index, which shows how US institutional investors are acting, has gone back to being positive. Historically, little positive readings mean that spot accumulation is happening during early trend reversals. This could mean that American investors are getting ready for a possible breakout.
BTC/USD Technical Setup: Compression Intensifies Ahead of FOMC
Technical expert Lennaert Snyder says that Bitcoin is still tightening up in a compression phase, with the market trading in a smaller and smaller range that suggests a bigger move is coming. The compression has made scalp transactions less rewarding compared to the risk, and the best times to trade are usually around the edges of ranges.
The main level of resistance is between $94,000 and $97,100. If the price breaks out above this zone, it could create long possibilities that aim for the $100,000 psychological threshold. On the other hand, important support is at $87,400, and a deeper support zone at $83,200 could draw in buyers if it is tested with a liquidity sweep.
Bulls need to protect the $86,000 level, which is still a key support zone, to stop the market from going down further more. If this level doesn’t hold, it might start a chain reaction that leads to the mid-$80,000 range, where patient investors may find good chances to buy more.
FOMC Decision: The Market’s Make-or-Break Moment
The direction of the cryptocurrency market in the near future depends a lot on the FOMC announcement on Wednesday and Federal Reserve Chair Jerome Powell’s press conference that followed. The 25-basis-point rate decrease is mostly priced in, but Powell’s comments on the future direction of policy and the updated dot plot predictions will be quite important in figuring out how the market feels.
If there is a confirmed cut and a dovish dot plot that predicts more cuts in 2026, Bitcoin might go up to between $92,000 and $95,000. This could cause short liquidation cascades of more than $120 million. In this case, the market would probably become more volatile, which could provide Bitcoin the push it needs to break above the $100,000 resistance level.
But if the Fed decreases rates but suggests a slower pace of declines in 2026, that may lead to profit-taking and a general risk-off mentality. This would probably push Bitcoin into the $88,000 to $89,000 range and put more pressure on the whole cryptocurrency market.
On-Chain Data Signals Cautious Optimism
Instead of frenzied speculation, Bitcoin’s on-chain measurements show that people are selectively accumulating it. The Percent Supply in Profit has gone raised a little, from 66.5% to 67.3%, which is a 1.2% gain. Even while this upward advance is good, the measure is still much below the 98.4% high that is usually seen in robust bull phases. This means that a lot of supply is still underwater.
The Short-Term Holder to Long-Term Holder Supply Ratio recently went up from 18.3% to 18.5%, breaking through the 17.6% upper band. This larger percentage means that short-term holders have more control over Bitcoin’s short-term direction, and their desire to sell when they make money has traditionally limited recoveries.
Exchange whale ratios, which show how much of the overall inflows come from the top 10 large wallets, are still high at 0.53. This has gone down from a high of 0.68 on November 27, but it still shows a range where whales might be getting ready to sell instead of buy. When this ratio continues high for several weeks, it is rare for durable market bottoms to occur.
Bitcoin Price Prediction: Multiple Scenarios for Year-End
Bull Case ($100,000–$111,500)
If the FOMC cuts rates in a dovish way and gives forward guidance that is helpful, and Bitcoin breaks over the $97,100 barrier level, it might reach $100,000 to $111,500 before the end of the year. In this case, ETF inflows need to stay over $200–$300 million every day, and institutional accumulation needs to get up again.
Base Case ($90,000–$95,000)
Bitcoin stays in its present range while the market waits for clearer macro signals before making a move in a certain direction. This situation presupposes that the FOMC meeting doesn’t provide any big surprises and that trading stays within a certain range until mid-December.
Bear Case ($80,000–$86,000)
If the Fed keeps talking tough even after cutting rates, or if Bitcoin doesn’t stay above the important $86,000 support level, the $80,000–$83,000 zone will probably be tested again. There is still an unfilled CME futures gap between $85,000 and $86,000, which could cause prices to fluctuate before a long-term rise.
- Check out our free forex signals
- Follow the top economic events on FX Leaders economic calendar
- Trade better, discover more Forex Trading Strategies
- Open a FREE Trading Account
- Read our latest reviews on: Avatrade, Exness, HFM and XM
Related Articles


Sidebar rates
Related Posts
