Ethereum Holds Critical $3,000 Support as Whales Accumulate and Treasury Companies Reduce Debt Positions
As of this writing, Ethereum (ETH) is still around $3,000, and it hasn't altered much in the last 24 hours. This is because market
Quick overview
- Ethereum's price remains stable around $3,000 as market participants analyze mixed signals from on-chain data and institutional positions.
- Corporations holding digital assets are prioritizing debt reduction, with firms like ETHZilla selling significant amounts of ETH to improve their balance sheets.
- Whale investors are accumulating Ethereum despite institutional sell-offs, indicating potential for future price growth as exchange supply drops significantly.
- Ethereum network activity is increasing ahead of a major upgrade in January, with more active addresses and transaction volumes reaching record highs.
As of this writing, Ethereum ETH/USD is still around $3,000, and it hasn’t altered much in the last 24 hours. This is because market participants are trying to make sense of mixed signals from on-chain data and institutional positions.
ETH Treasury Companies Prioritize Debt Reduction Amid Market Volatility
There is a big change happening in the crypto treasury world as corporations who own digital assets are under more and more pressure to improve their balance sheets during times of market instability. ETHZilla, a crypto treasury firm that switched from biotechnology early this year, just announced that it sold 24,291 ETH for $74.5 million, or an average of $3,068.69 per token. The money will be used to pay off outstanding senior secured convertible notes, leaving the company with about 69,800 ETH on its balance sheet.
This deal is part of a larger trend among digital asset treasury companies. Other companies in the same field have made similar measures. For example, FG Nexus sold 10,922 ETH in late October to pay for a share buyback program, and Sequans Communications used the money from selling half of its convertible notes in November to pay down its debt. Even Strategy, which was the first company to use Bitcoin treasury methods, sold stocks to raise $747.8 million to boost its cash reserves amid the recent slump.
The pattern shows how treasury firms are dealing with long-term price swings by focusing on managing their debts instead of aggressively building up their assets. Bitcoin has dropped from its all-time high of $126,000 in October, and other cryptocurrencies like Ethereum are also losing value. As a result, institutional investors are becoming more careful with their balance sheets.
Whale Accumulation and Exchange Supply Dynamics Signal Structural Strength
Even while institutions are selling off their Ethereum, big holders have been buying a lot of it amid the recent price drop. After six months of steady buying, whale wallets holding between 10,000 and 100,000 ETH currently own more than 22 million tokens, according to data. This trend of accumulation is very different from what retail and mid-size investors have been doing since 2024, when they started selling.
Market analysts say that big whales usually buy when assets are undervalued before rallies start, not when prices go up. According to experts who are keeping an eye on holder distribution patterns, the fact that whale buying rates are at all-time highs means that there is a lot of room for growth.
Exchange supply data back up this positive stance. ETH supply on controlled exchanges has dropped 45% to 10.2 million ETH, the lowest level in nine years. This is down from 18.5 million ETH in early July. This big drop shows that tokens are either going to cold storage or being locked up in smart contracts instead of being easy to sell right away. Analysts say that this supply shock could make prices fluctuate further when buyers come back in large numbers.
New Binance netflow data gives us even more proof. There are steady net outflows from the exchange, and the Net Unrealized Profit/Loss (NUPL) values are stable around 0.22. This suggests that holders are making long-term plans instead of taking profits quickly. This kind of activity usually happens before the market gets healthy and there is less need to sell.
Ethereum Network Activity Rebounds as January Scaling Upgrade Approaches
The basic metrics for Ethereum are showing signs of resurgence again, however this may not yet be fully represented in the price. There were 22% more active addresses in the last week, and the average number of transactions each month went up 16% to 11.3 million. In December, the number of new wallets created reached 163,000 daily addresses, up from 124,000 in July. This shows that more people are using the network.
Transaction volumes are still at record highs, showing that there is still a lot of demand for Ethereum’s infrastructure. This event happens before a big upgrade to the network in January that will raise the number of transactions that can be processed from 60 million to 80 million. Analysts think the market hasn’t yet priced this in.
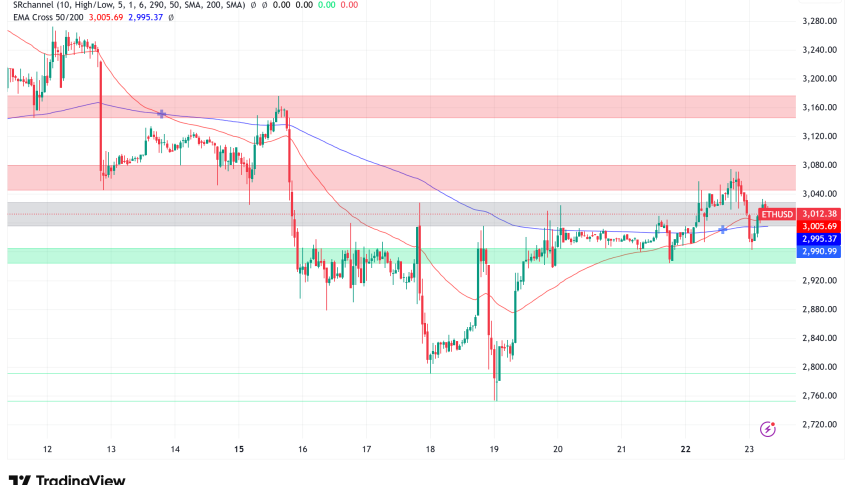
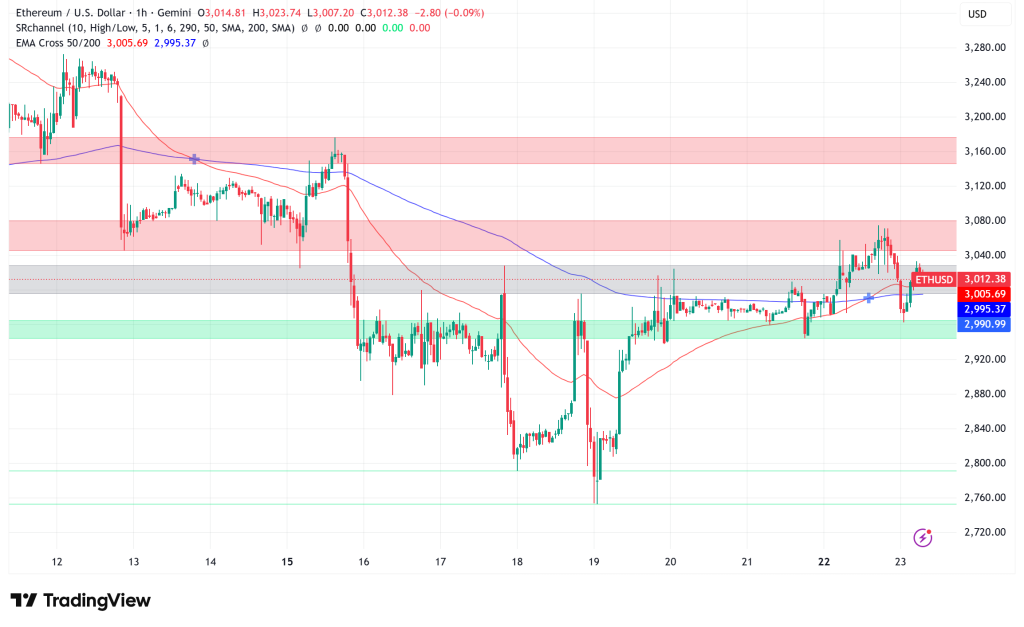
ETH/USD Technical Outlook: Key Resistance Levels Define Near-Term Price Action
From a technical point of view, Ethereum is trying to stay stable between $3,000 and $3,100, which is in line with the rising 200-week moving average, which is an important long-term trend indication. The price is currently trading just above this support level, but it is experiencing opposition from the 50-week moving average. This shows that it is still having trouble getting back to a steady upward trend.
Analysts say that the $3,100-$3,200 zone is an important level of resistance that has turned down several attempts to recover. If the price goes above $3,200, it might start to rise toward $3,650-$3,700 at first, with the $4,000 mark being the next big hurdle. Some people are even more hopeful and say that the channel structure is getting wider, which might finally lead to a target of $7,000.
The 50-day exponential moving average at $3,150 is another important technical barrier. If ETH breaks above this level and purchasing volume goes up, it might quickly rise to $3,450 and then $4,000.
But if Ethereum doesn’t get back into the $3,300–$3,500 resistance range, it could be stuck in a long consolidation phase. For the long-term uptrend structure to stay in place, support must stay above $2,900–$3,000.
- Check out our free forex signals
- Follow the top economic events on FX Leaders economic calendar
- Trade better, discover more Forex Trading Strategies
- Open a FREE Trading Account
- Read our latest reviews on: Avatrade, Exness, HFM and XM
Related Articles


Sidebar rates
Related Posts
