Bitcoin Holds Above $88,000 as Mixed Signals Cloud Q1 2026 Outlook
At the time of writing, Bitcoin (BTC) is trading above $88,000, which represents a small gain of 1.6% over the last 24 hours. However, the
Quick overview
- Bitcoin is currently trading above $88,000, showing a slight gain but struggling to reach the critical $90,000 mark.
- Recent social sentiment data indicates a shift towards bullish comments, which historically may signal a market downturn.
- Analysts suggest a potential bullish trend could emerge in early 2026 if Bitcoin's Supply in Profit indicator stabilizes.
- Technically, Bitcoin faces resistance in the $88,000 to $90,000 range, with key support levels identified below.
At the time of writing, Bitcoin BTC/USD is trading above $88,000, which represents a small gain of 1.6% over the last 24 hours. However, the top cryptocurrency is at a very key point right now since it is having trouble getting back to the psychologically important $90,000 mark. Technical and mood indicators are giving contradictory signals for the year ahead.
Bitcoin’s Social Sentiment Flashes Contrarian Warning Signal
As 2025 comes to a close, new data from analytics company Santiment shows a big change in how people feel about retail. For the first time in a few weeks, social media volume tracking both Bitcoin-related phrases and sentiment indicators shows that bullish comments are outperforming pessimistic ones. In particular, comments that include “higher” and “above” have increased compared to “lower” and “below,” which shows that retail traders are becoming more positive.
But this change could, in a strange way, be a hint that the market is going down. Over the past three months, historical trends show that Bitcoin tends to move against what most people think will happen. For example, price rebounds often happen after surges in pessimistic sentiment, and local tops often happen when there is a lot of greed. The recent rise in positive mood, albeit not very high, shows that traders should be careful as they ring in the New Year.
In addition to the neutral prognosis, CryptoQuant analyst Maartunn points out that Bitcoin returns have stayed the same across all significant trading sessions in the US, Europe, and Asia-Pacific. This consistency shows that no one geographic demography is generating momentum, and market activity is “neutral across the board.”
BTC Supply in Profit Metric Points to Potential Q1 Recovery
Axel Adler, an on-chain analyst, sees an interesting structural change that could lead to a new bullish trend in early 2026, even though things are murky right now. Bitcoin’s Supply in Profit indicator has dropped drastically from its peak in October, when it was over 19 million BTC, to about 13.5 million BTC after the price adjustment from all-time highs.
This drop made the 30-day and 90-day moving averages quite far apart, by over 1.75 million BTC. The 30-day average seems to have found a local bottom in mid-December, which is very important, and it is now stabilizing. Adler’s forecast model, which looks at how these moving averages are getting closer to each other, says that a bullish cross could happen between the end of February and the beginning of March, as long as prices stay where they are.
The convergence is getting smaller, with about 28,000 BTC every day, mostly because the highest values from October are no longer in the 90-day computation frame. But this argument is still quite sensitive to price changes. If supply elasticity is 1.3x, a 10% drop in price would cause Supply in Profit to drop by 13%. The important mark is $70,000. If the price stays below this level for a long time, the bullish convergence scenario is likely to fail, and there is a chance of a long correction like the one that happened in 2022.
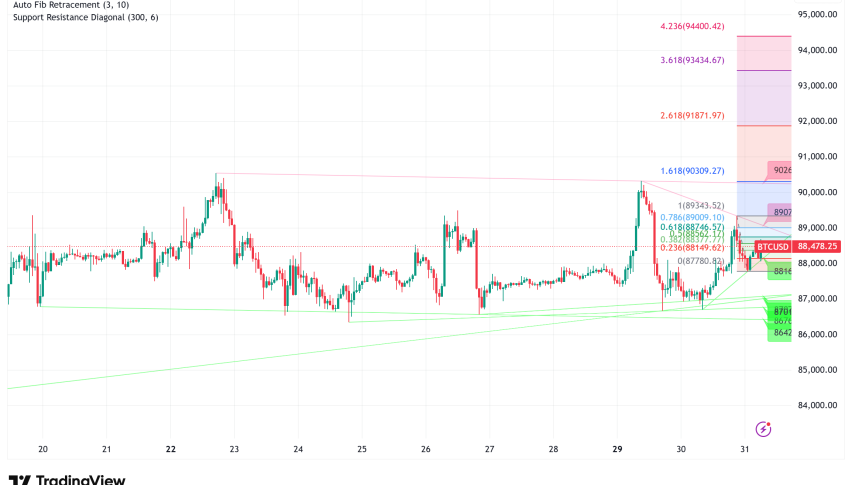
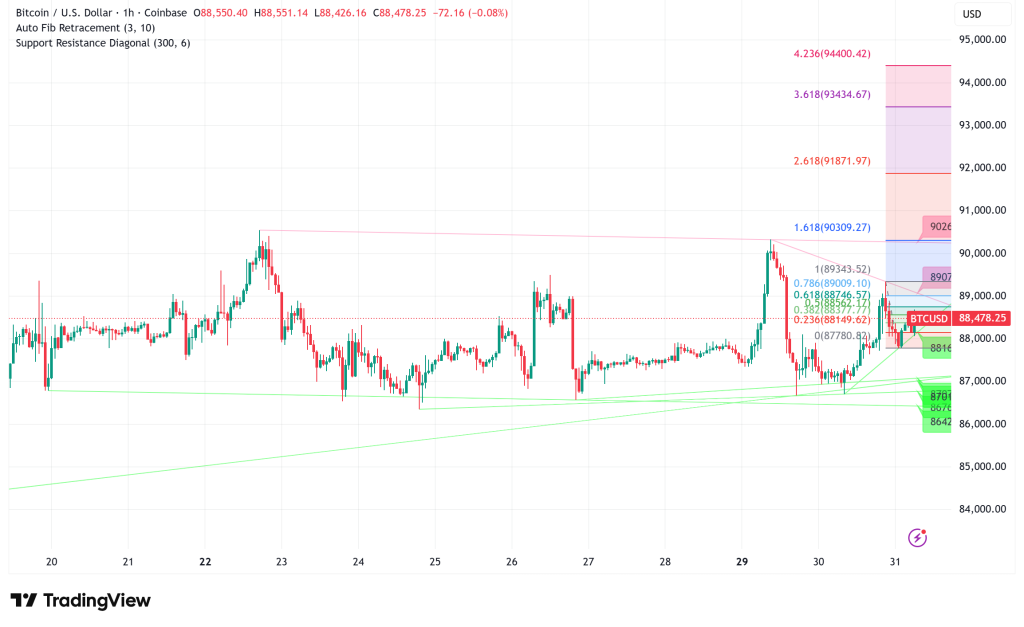
BTC/USD Technical Picture: Resistance Overhead, Support Holding
Bitcoin’s immediate fight is in the $88,000 to $90,000 range from a technical point of view. BTC broke out of a downward channel with resistance at $87,300 and has since regained ground above its 100-hour simple moving average. It has also established firm support at $86,700.
There are definite levels of resistance along the way. The first is $88,900, which is the 61.8% Fibonacci retracement of the recent drop. Then come $89,500, $90,200, and finally $91,200–$91,500. A strong break above $90,000 would mean that bulls are back in charge and could perhaps lead to challenging previous highs.
On the other hand, not keeping present levels puts you at risk of going down. $87,500, $86,700, and $85,500 are important support levels, while $85,000 is a key line in the sand. The 50-day and 100-day moving averages are still above, showing that the negative trend structure has been in place since the price broke down from $100,000 to $105,000.
Bitcoin Price Prediction: Cautious Optimism for Q1 2026
- Near-term target (January 2026): $85,000-$92,000 range-bound trading
- Q1 2026 target: $95,000-$105,000 if bullish cross materializes
- Bear case: Breakdown below $85,000 targets $70,000-$75,000
- Check out our free forex signals
- Follow the top economic events on FX Leaders economic calendar
- Trade better, discover more Forex Trading Strategies
- Open a FREE Trading Account
- Read our latest reviews on: Avatrade, Exness, HFM and XM
Related Articles


Sidebar rates
Related Posts
