XRP Stabilizes Near $2.10: Leverage Flush and New Institutional Ventures Set Stage for Potential Parabolic Run
XRP is trading at $2.10, down 1% in the last 24 hours. The crypto is moving inside a small range after a strange two-sided liquidation event
Quick overview
- XRP is currently trading at $2.10, down 1% in the last 24 hours, and is experiencing a range-bound trading pattern between $2.07 support and $2.17 resistance.
- Recent liquidation events on Binance Futures have cleared market leverage, indicating uncertainty in the market rather than a definitive trend.
- Institutional interest in XRP remains strong, with Evernorth exploring the use of the XRP Ledger for liquidity and treasury management.
- The future price movement of XRP hinges on maintaining support at $2.07–$2.08, with potential upside targets at $2.17 and beyond, while a drop below $2.07 could signal a bearish trend.
XRP XRP/USD is trading at $2.10, down 1% in the last 24 hours. The cryptocurrency is moving inside a small range after a strange two-sided liquidation event on Binance Futures that got rid of leveraged positions from both sides. The digital asset is still stuck between apparent technical limits around $2.07 support and $2.17 resistance. Traders are looking for a new event to break the existing pattern of consolidation.
Symmetrical Liquidation Event Clears Market Leverage
The recent price movements show that the market is being driven by derivatives, and that XRP’s near-term path is being decided by resets in leverage rather than changes in fundamentals. The liquidation sequence happened in two parts. On January 5, when XRP shot up to $2.40, there were over $4.4 million in short liquidations, which forced bearish traders to cover their holdings. The next day, there were about $5.5 million in long liquidations, which hurt people who were trying to break out and brought the price back near the middle of the range.
This symmetrical liquidation cascade usually means that the market is unsure, not that a trend is definitely going to happen. The event took away too much leverage and lowered the chance of a big loss, but it also showed that the market is still looking for direction and is willing to penalize traders on both sides of the deal.
XRP/USD Technical Analysis Points to Range-Bound Trading
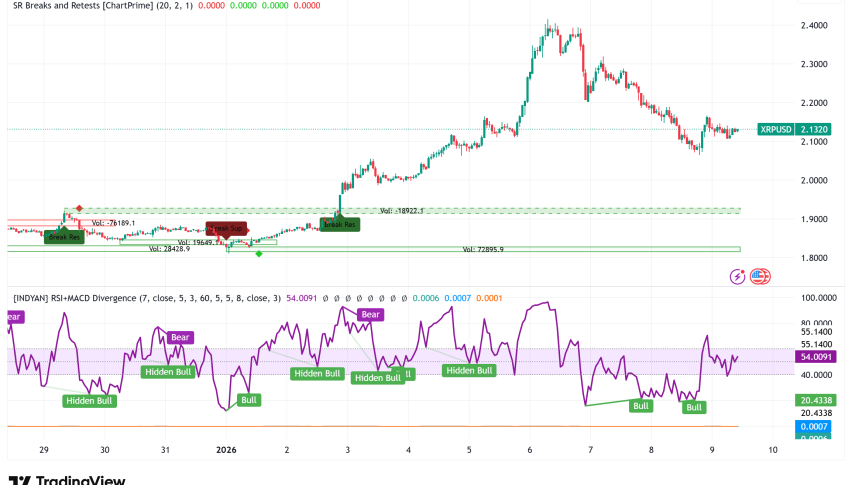
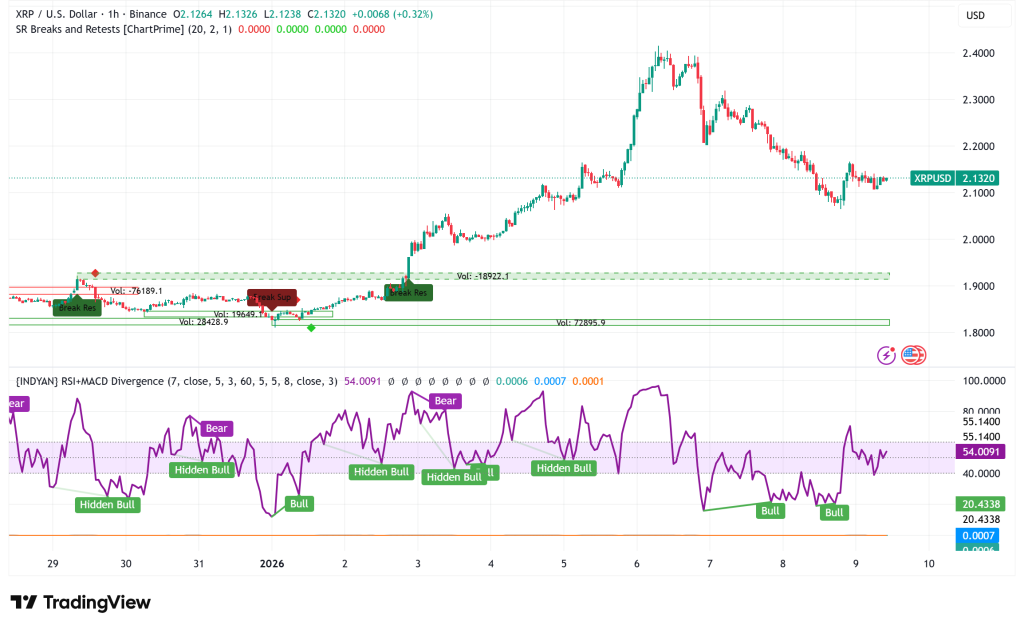
XRP fell 2.3% from $2.17 to $2.12 in the 24 hours ended on January 9, giving it a trading range of about 4.9%. The most important technical change has been the persistent defense of the $2.07–$2.08 demand zone, which has stopped selling pressure several times.
The volume data shows how strong this support level is. At 14:00 UTC on January 8, volume shot up sharply, with 154.85 million XRP changing hands—93% more than the 24-hour simple moving average of 66.4 million—as the price tested the lower barrier. Buyers quickly took on this selling pressure, which caused a V-shaped recovery that took XRP from $2.09 to $2.16 between 15:00 and 17:00 on steady activity.
But rallies have always stopped near $2.17, which shows that there is resistance to supply at this level. The price activity is still turbulent and reactive on shorter periods. The 60-minute chart revealed a small flush-and-rebound pattern. XRP fell from $2.131 to $2.119 between 01:22 and 01:36 on about 18.2 million in sale volume, then bounced back to $2.141 about 01:30. But the rally didn’t last long, and the failure to go back to $2.135 strengthened the case for consolidation.
Technical signs show that there is still a lot of uncertainty. The hourly MACD is losing steam in the negative zone, and the Relative Strength Index has dropped below the neutral 50 mark. This means that neither bulls nor bears are in charge.
Institutional Infrastructure Developments Continue
Even if the price of XRP has been going up and down a lot in the near term, it is still getting a lot of interest from institutional infrastructure. Evernorth, a digital asset treasury company for XRP funded by Ripple and SBI Holdings, said it would work with Doppler Finance to look into how institutions might use the XRP Ledger for liquidity and treasury purposes.
This project is in the exploratory phase, which means that it is looking into frameworks for structured liquidity deployment and treasury management instead of launching a product right now. The timing shows that there is a gap between positive infrastructure stories and market movement driven by derivatives in the short run.
XRP Price Prediction: Critical Levels Define Next Directional Move
The short-term future of XRP depends on two well-defined technical levels. XRP will probably keep trading in a range if the $2.07–$2.08 support zone stays strong. The next test of the upside will be at $2.17, followed by $2.20. If the market breaks cleanly over $2.17 and there is follow-through volume, the structure of the market will change from “consolidation” to “trend.” This might lead to $2.25–$2.30 and finally test the $2.40 level.
On the other hand, if the price drops below $2.07, the range would end to the downside, and $2.05 would become the first support level, followed by $1.85–$1.90 as the next important demand zone from the last correction phase.
XRP’s Longer-Term Outlook Tied to Bitcoin Dominance
Crypto analyst Bird has said that XRP may be getting up for its biggest surge ever, based on patterns in Bitcoin’s dominance. The expert said that Bitcoin’s market share has declined a lot during XRP’s three previous parabolic runs in 2018, 2021, and 2024. Bitcoin’s dominance looks like it’s rolling over again after testing its trendline again. This might lead to a verified breakdown that would cause XRP to rise significantly.
If this assumption is right and Bitcoin’s market share drops to the 40–44% range, XRP might enter real price discovery phase, which could lead to prices in the double digits. But this is still a long-term possibility that depends on how the market as a whole works.
- Check out our free forex signals
- Follow the top economic events on FX Leaders economic calendar
- Trade better, discover more Forex Trading Strategies
- Open a FREE Trading Account
- Read our latest reviews on: Avatrade, Exness, HFM and XM
Related Articles


Sidebar rates
Related Posts
