Silver Price Forecast: XAG/USD Eyes $96 as Tariff Tensions and RSI Surge Fuel Rally
Silver (XAG/USD) is trading at $93.25, recently jumping as investors scramble to lock into safe-haven assets following Donald Trump's...
Quick overview
- Silver (XAG/USD) is currently trading at $93.25, driven by increased demand for safe-haven assets following new tariffs imposed by Donald Trump on eight European nations.
- The price of silver has outperformed gold, reaching a record high of $94.03/oz, amid rising geopolitical tensions and expectations of Federal Reserve interest rate cuts.
- Technical analysis shows silver is in a bullish trend within a rising price channel, with key resistance levels at $93.57 and potential targets of $96.70 and $100.75.
- Fundamentally, silver benefits from industrial demand, ETF inflows, and a dovish shift from central banks, making it an attractive investment amid lower inflation.
Silver (XAG/USD) is trading at $93.25, recently jumping as investors scramble to lock into safe-haven assets following Donald Trump’s bombshell announcement that he’s slapping new tariffs on eight European nations – all in a bid to buy Greenland. This move has really set alarm bells ringing, as people worry it could be the start of a much broader trade dispute between the US and Europe, which is sending silver demand through the roof.
Now, one of the big reasons silver is doing so well right now is that it’s got a reputation as a safe-haven & industrial metal, which means its price is on the rise as investors use it to hedge against market volatility. It even outperformed gold on a percentage basis, hitting a record high of $94.03/oz. To make matters worse for other assets, we’re seeing a rise in geopolitical tensions & growing expectations that the Fed will cut interest rates, which is only adding fuel to silver’s bullish story.
Silver (XAG/USD) Technical Analysis: A Rising Channel & a Bullish Narrative
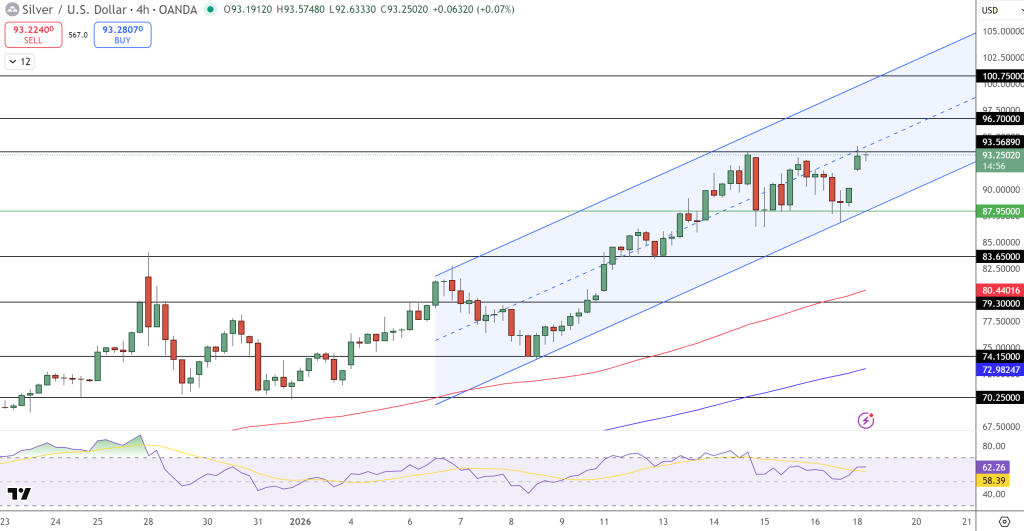
On the 4-hour chart for XAG/USD, the price is zooming upwards within a rising price channel, with support at higher lows and a resistance ceiling just above $93.57. The last candle really shows what happened – it pushed off a low of $92.63 with a great deal of force, and the indicators are really saying this is a bullish move.
[[XAG/USD-graph]]
Trading Levels: It’s worth watching these key levels:
- Upside Resistance: $93.57, $96.70, $100.75
- Downside Support: $87.95, $83.65, $80.44
- RSI & Moving Averages: the RSI is currently at 62.26, which is just below the moving average of 58.39; both the short & long term MAs are going up
The RSI is rising – but it’s not yet so high that we can rule out further price gains. If we break through $93.57, watch out for $96.70 & then $100.75 as potential targets – but if we can’t hold above $92.63, we might see a test of lower support levels in the channel.
Silver’s Macro Story is Even More Bullish
This isn’t just about technicals – the fundamental picture is strong for silver too. In addition to gold, it’s getting a lift from:
- Tensions between the US & Europe (tariffs, Middle East conflicts, etc.).
- Rate cuts from the Federal Reserve
- Industrial demand from the clean energy & electronics sectors
- ETF inflows & institutional buying
And to top it all off, we have lower inflation & central banks shifting to a more dovish stance, making non-yielding assets like silver more attractive.
Gold Trade Setups & Outlook
For now, the bias is definitely to the upside, but it’s still pretty volatile. Consider:
- Buying above $93.57, with a stop-loss just below $92.63 & a target of $96.70.
- Selling below $92.63 with a stop-loss above the higher resistance & a target of $87.95.
- Check out our free forex signals
- Follow the top economic events on FX Leaders economic calendar
- Trade better, discover more Forex Trading Strategies
- Open a FREE Trading Account
- Read our latest reviews on: Avatrade, Exness, HFM and XM
Related Articles
Sidebar rates
Related Posts
