Silver Price Prediction: Silver Smashes Historic $100 — Is This Rally Sustainable?
Silver has moved into uncharted territory in early 2026, breaking above the historic $100 per ounce level for the first time and marking...
Quick overview
- Silver has surpassed the historic $100 per ounce level for the first time in early 2026, marking a significant bull run.
- The price of silver has increased over 37% in just one month and is up more than 220% year over year.
- The surge in silver prices is driven by real supply constraints and growing industrial demand, particularly from solar energy.
- Technical analysis indicates that silver is consolidating just below $100, with key support at $95.80 and potential for further gains.
Silver has moved into uncharted territory in early 2026, breaking above the historic $100 per ounce level for the first time and marking one of the strongest bull runs in its modern history. As of January 23, 2026, spot silver is trading around $99–$100, up roughly 3% on the day, after printing fresh all-time highs near $99.87 on platforms such as APMEX and pushing through $100 in futures and regional markets, including Shanghai.
What stands out is the speed of the move. Silver has gained more than 37% in just one month, while longer-term data shows prices up over 220% year over year. For context, a 220% yearly gain means silver is now more than three times higher than it was a year ago. If silver was trading near $30 per ounce last year, a 220% increase adds roughly $66, lifting the price close to $100 today. Moves of this scale highlight exceptionally strong demand but also explain why volatility has increased.
What’s driving silver’s surge?
The rally is being powered by real supply constraints and measurable demand growth, not just speculation. Analysts estimate the silver market is heading into a fifth straight annual supply deficit. Global mined supply has remained largely flat at around 813–835 million ounces, while primary silver production stands near 227 million ounces. Recycling, despite reaching a 13-year high, has grown by only about 1%, failing to close the gap. Cumulative deficits from 2021 to 2025 are estimated at 820–900 million ounces, nearly equal to a full year of global mine output.
[[XAG/USD-graph]]
On the demand side, industrial use now accounts for nearly 60% of total silver consumption. Solar energy is the largest driver, with global photovoltaic capacity expected to reach around 665 GW in 2026, supporting 120–125 million ounces of silver demand. Electronics, electric vehicles, data centers, and grid upgrades have pushed total industrial demand toward 680 million ounces, near record levels.
Financial flows have added momentum. With gold trading near $4,700–$4,800 per ounce, investors have turned to silver as a lower-priced, higher-beta alternative. A weaker US dollar and expectations of easier monetary policy later in 2026 have further boosted inflows.
Silver (XAG/USD) Technical picture after the $100 breakout
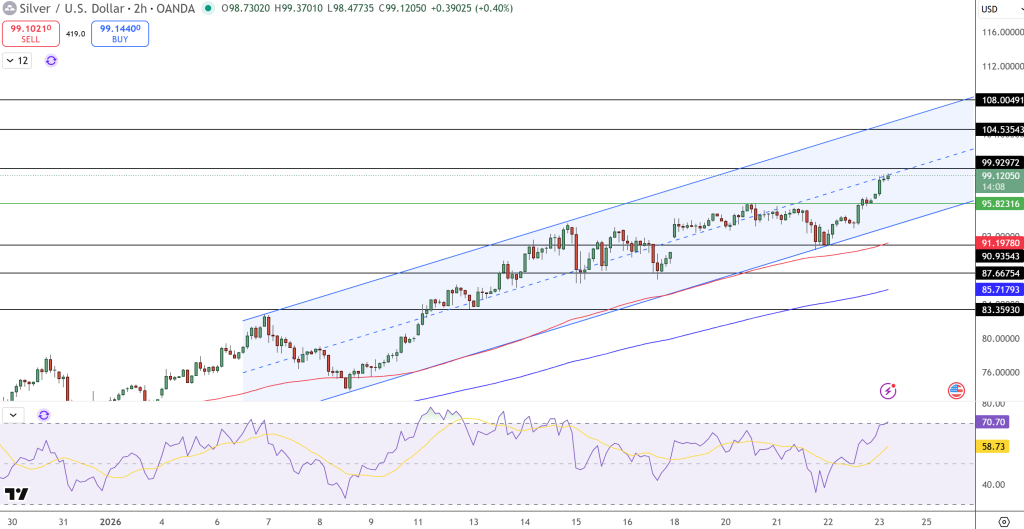
Technically, silver is now consolidating just below $100–$101, showing digestion rather than reversal. Price is holding above $95.80, a former resistance level that has flipped into key support. The broader trend remains intact within a rising price channel.
Short-term price action shows smaller candles and shorter wicks, signaling balance after a sharp run. Below, $91.20 is the next major support. Above, a clean break over $101 would open the door toward $104.50. RSI remains near overbought levels, suggesting pullbacks may be sharp but normal within a strong trend.
Trade idea: Buy pullbacks near $96.00, target $104.50, stop below $93.80.
- Check out our free forex signals
- Follow the top economic events on FX Leaders economic calendar
- Trade better, discover more Forex Trading Strategies
- Open a FREE Trading Account
- Read our latest reviews on: Avatrade, Exness, HFM and XM
Related Articles

Sidebar rates
Related Posts
