Bitcoin Holds Steady Above $89K as February Rally Signals and Gold Divergence Spark Debate
Bitcoin (BTC) is trading above $89,000. The price hasn't changed much in the last 24 hours, but the market is entering a moment that might
Quick overview
- Bitcoin is currently trading above $89,000, with February historically being a strong month for the cryptocurrency.
- Timothy Peterson highlights that February has shown a median return of 8.4% for Bitcoin, driven by macroeconomic factors like corporate earnings announcements.
- Concerns arise as the BTC/XAU ratio has fallen below its long-term trend, indicating potential technical weakness for Bitcoin.
- Predictions for Bitcoin's price range widely, with some analysts forecasting a rise to $210,000-$300,000 by 2026, while others warn of a possible drop to $50,000.
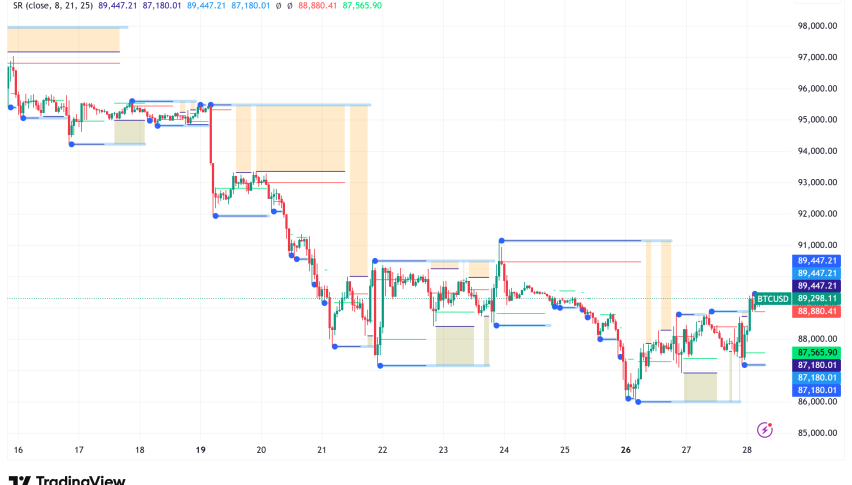
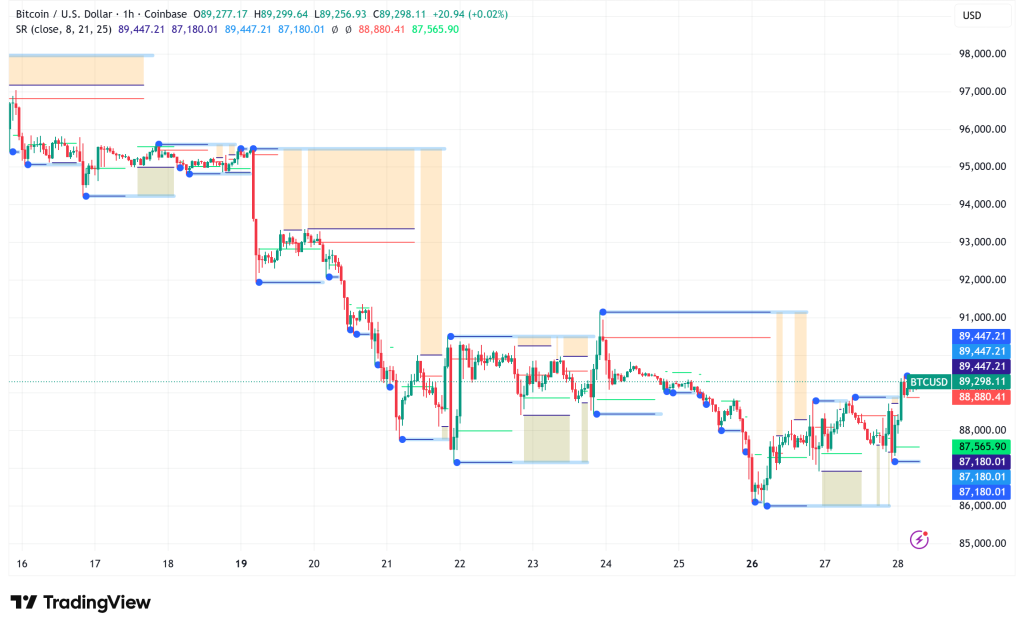
As of this writing, Bitcoin BTC/USD is trading above $89,000. The price hasn’t changed much in the last 24 hours, but the market is entering a moment that might be very important for price direction. Even though it only went up 2.2% in January, historical patterns and technical analysis imply that February could be a big turning point for the world’s largest cryptocurrency.
Historical Patterns Point to February Strength: The Real “Uptober” Effect
Timothy Peterson, a network economist, has named February the most consistently optimistic month for Bitcoin since 2016, calling it the real “Uptober.” The numbers are convincing: the week ending February 21 has historically had a median return of 8.4%, and Bitcoin has closed higher 60% of the time during this time.
Peterson says that this seasonal surge is due to macroeconomic issues rather than anything special to bitcoin. In the middle of February, companies usually announce their full-year earnings and give positive guidance for the future. This makes investors more willing to take risks. “The two-week period from February 7 to 21 has a median weekly return of at least 7% per week!” Peterson said.
However, early February performance has been a good sign of years that will be bad. In 2018, 2022, and especially 2025, Bitcoin was sluggish in the first three weeks of February. All of those years ended lower. The 5% drop this year in early 2025 has prompted concerns, but Peterson says that if macroeconomic stress indicators like the VIX calm down, Bitcoin could be ready to bounce back.
BTC/USD Technical Breakdown: The Bitcoin-Gold Ratio Signals Trouble
Bitcoin’s performance compared to gold XAU/USD may be becoming worse, which could be bad news for the market. According to expert Julius, the BTC/XAU ratio has fallen below its long-term Power Law trend for the first time in history. In the past, this indicator has been good at finding the bottoms of cycles and times when prices were too high.
The ratio has fallen below the 200-week exponential moving average, which used to be where real Bitcoin cycle bottoms were. In 2022, there was a similar false breakdown that lasted a while before things got better. But right now, with gold prices rising above $5,000 and Bank of America expecting $6,000 gold by the end of the year, this divergence could last longer.
This technical weakness makes worries about the four-year cycle theory breaking down more believable. Some analysts say that if the historical pattern doesn’t hold, BTC might drop to $50,000.
Bitcoin Price Prediction: Conflicting Signals Create Wide Range of Outcomes
The technical picture shows two quite different situations. Sminston With, a Bitcoin researcher, is still optimistic about the long term. He uses the Bitcoin Decay Channel to predict that the price would reach a high of between $210,000 and $300,000 in 2026. This fits with what Standard Chartered and other companies have said, which is that the price will reach $140,000 or more.
Sina, the author of the Bitcoin Intelligence Report, says that Bitcoin’s momentum has turned positive even though there have been recent dips. This supports the bull thesis. Consolidation has kept the overall flow structure intact. XWIN Research says that the growing Realized Cap shows that capital is still entering the network through spot-based transactions.
But the price action right now suggests that prudence is best. If the difference between BTC and gold keeps going and the economy stays stressed, Bitcoin might drop to lower support levels in the $70,000–$80,000 region before any rally in February. On the other hand, if gold’s advance stops like Citi says it might when real yields go up and people start to feel more comfortable with risk, Bitcoin could quickly rise back to $100,000–$110,000.
- Check out our free forex signals
- Follow the top economic events on FX Leaders economic calendar
- Trade better, discover more Forex Trading Strategies
- Open a FREE Trading Account
- Read our latest reviews on: Avatrade, Exness, HFM and XM
Related Articles


Sidebar rates
Related Posts
