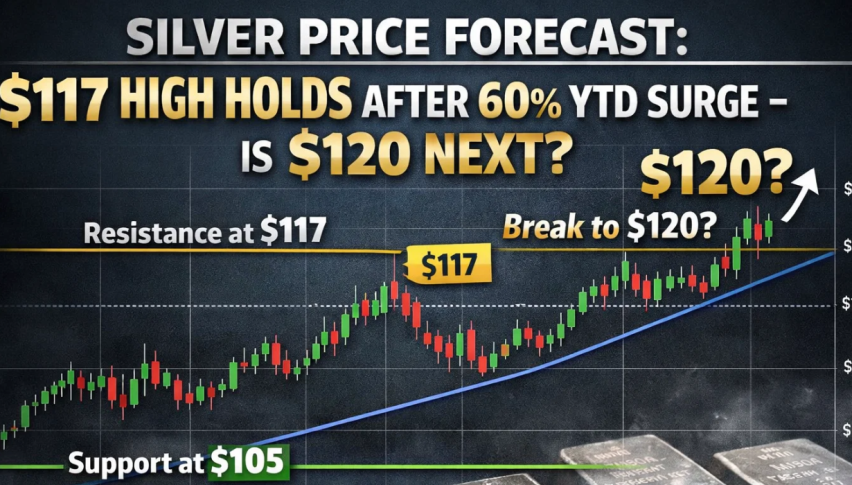
Silver Price Forecast: $117 High Holds After 60% YTD Surge – Is $120 Next?
Silver (XAG/USD) is holding steady near $112.90 to $113.00 after pulling back from its recent record high of about $117.70...
Quick overview
- Silver (XAG/USD) is currently stable around $112.90 to $113.00 after a recent peak of approximately $117.70.
- Despite a dip, the overall trend remains positive, with silver gaining about 60% in 2026 and over 250% compared to last year.
- Technical indicators suggest that the recent pullback is a consolidation phase rather than a trend reversal, with key support levels holding firm.
- Traders are advised to buy on pullbacks above $111, targeting prices between $118 and $121, while monitoring for a potential drop below $107.
Silver (XAG/USD) is holding steady near $112.90 to $113.00 after pulling back from its recent record high of about $117.70. This dip has slowed short-term momentum, but the overall trend still looks positive. In 2026, silver has gained about 60% so far, building on strong gains from 2025. Compared to last year, prices are up more than 250%, showing just how much the market has shifted.
This pause seems more like the market taking a breather than reversing direction. The price action shows that gains are being absorbed, not given up, as buyers keep supporting important technical levels.
Silver (XAG/USD) Technical Structure: Watching Trendlines and Fibonacci Levels
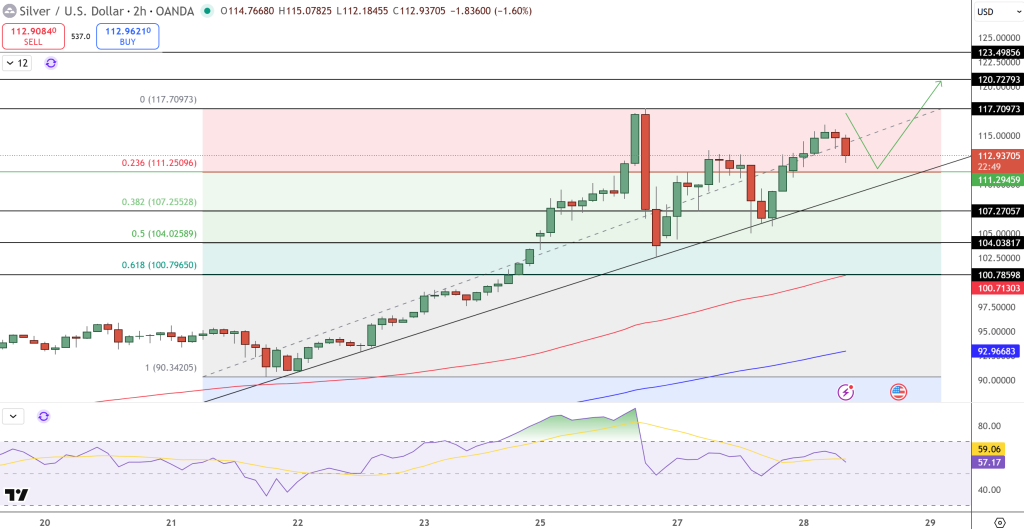
Looking at the 2-hour chart, silver is still trading above a rising trendline that starts from the January lows, keeping the short-term uptrend in place. The recent dip has held above the 23.6% Fibonacci retracement near $111.25, which has served as the first support level.
[[XAG/USD-graph]]
The candlestick patterns are worth noting. Several recent candles have long lower wicks near $112, which suggests buyers are stepping in on dips instead of sellers taking control. The price is still moving within a rising channel, and there has not been a confirmed break below channel support.
If volatility picks up, the 38.2% Fibonacci level near $107.25 is a deeper support area that still looks healthy from a technical perspective. The current structure would only weaken if prices fall below that level.
Momentum Slows but Stays Positive
Momentum indicators back up the idea of consolidation. The RSI has dropped to the 55 to 60 range, moving away from overbought levels but not showing bearish signs. This usually means the trend is cooling off, not ending.
Silver is still trading above its short-term moving averages, which supports the idea that this pullback is just a correction, not the end of the trend.
Silver Price Outlook and Trade Plan
As long as silver stays above $111, there is still a path toward $117.70, and possibly up to $120.70 if momentum picks up again. If the price breaks above the recent high, it could attract new buyers following the trend.
Trade idea: Look to buy on pullbacks above $111, aiming for $118 to $121, and consider exiting if the price falls below $107.
- Check out our free forex signals
- Follow the top economic events on FX Leaders economic calendar
- Trade better, discover more Forex Trading Strategies
- Open a FREE Trading Account
- Read our latest reviews on: Avatrade, Exness, HFM and XM
Related Articles


Sidebar rates
Related Posts
