Solana Faces Critical Support Test as Head-and-Shoulders Pattern Points to $50 Breakdown
Solana (SOL) is down 1.1% over the last day, trading around $86. This is due to increasing technical pressure on the seventh-largest crypto
Quick overview
- As of February 10, 2026, Solana (SOL) is down 1.1% and trading at approximately $86, having fallen 72% from its January 2025 peak of $295.
- Technical analysts have identified a classic head-and-shoulders pattern, suggesting potential declines to as low as $30 to $50.
- Despite the bearish outlook, on-chain metrics indicate a critical support level at $75, which could signal a potential bottom for the cryptocurrency.
- Analysts predict varying outcomes for Solana, with short-term targets suggesting further declines while long-term forecasts hint at possible recovery.
As of February 10, 2026, Solana SOL/USD is down 1.1% over the last day, trading at about $86. This is due to increasing technical pressure on the seventh-largest cryptocurrency by market value. From its January 2025 cycle peak of $295, the asset has fallen 72%, and several analysts have warned that more declines might drive values as low as $30 to $50.
Classic Head-and-Shoulders Pattern Signals Extended Decline
Across several periods, technical analysts have discovered a classic head-and-shoulders (H&S) formation, a bearish reversal pattern that usually portends substantial downside in the future. The collapse was validated by cryptocurrency expert Bitcoinsensus, who said that “Solana has confirmed a breakdown from this macro Head & Shoulders pattern” and that a calculated target might make $50 per SOL.
The two-day candlestick chart shows that on January 30, the pattern’s neckline broke at $120. A conservative objective of $57, or a 32% drop from current levels, is obtained by applying the traditional H&S measurement approach, which involves determining the distance between the pattern’s head and neckline and projecting it downward from the breakdown point.
On the two-week chart, analyst Nextiscrypto confirmed this pessimistic view by spotting “a classic head and shoulders pattern with a measured move to $45.” Worse, the pseudonymous analyst “Shitpoastin” pointed out a “massive head and shoulders” pattern on the two-year monthly timescale, indicating “nothing but air until $30.”
MVRV Bands Offer Glimmer of Hope Near $75
On-chain measurements offer a possible bright spot despite technical patterns’ pessimistic outlook. The present essential support level for Solana’s Market Value to Realized Value (MVRV) extreme deviation price bands is $75, which has historically indicated important bottoming forms.
When SOL trades above or below the average price at which investors last moved their coins, the MVRV bands record the change in price. SOL usually finds bottoms close to or below the lowest MVRV band, according to historical experience. In March 2022, SOL tested the lowest MVRV deviation band at $75 and recovered 87% in three weeks to $140. In December 2020, a similar trend became apparent.
Traders should be aware of the exception, though: Due to Solana’s involvement in the November 2022 FTX collapse, prices diverged considerably from this range, falling another 70% to a low of about $7 in December 2022. A break below $75 might set off the subsequent leg down toward the head-and-shoulders objectives if history is any indication.
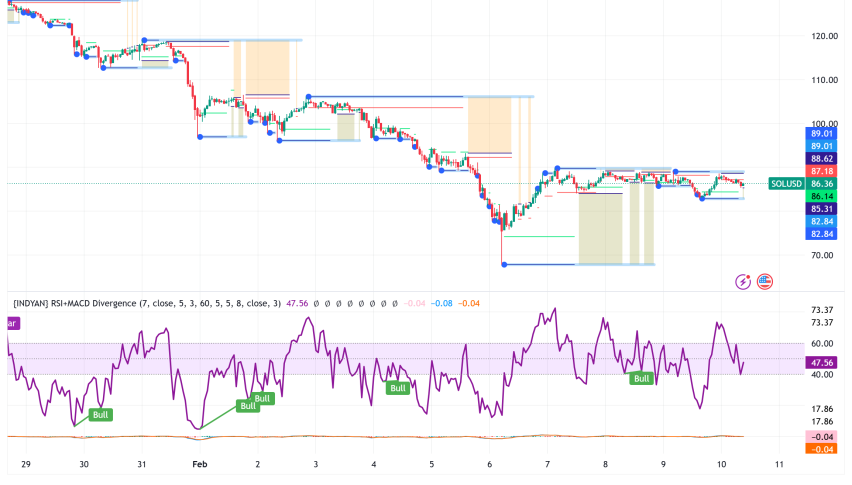
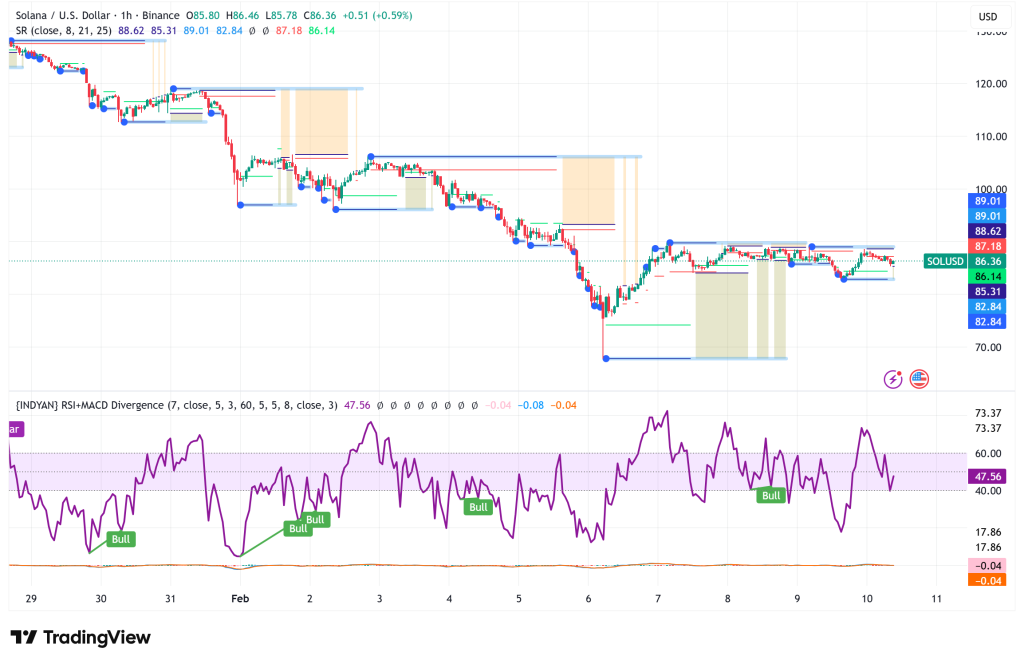
SOL’s Short-Term Price Action Shows Bearish Rejection
Just below the $95 breakdown level, Solana’s recent recovery bounce has run into selling pressure, indicating that bears are successfully protecting this level and trying to turn it into resistance. Critical levels are shown on the daily chart: a break below $77 would confirm ongoing bearish control and probably lead to a retest of the recent $67 bottom set on Friday.
The picture presented by technical indicators is conflicting but cautiously negative. The MACD is still negative at -0.56, but it is beginning to turn positive. The Relative Strength Index (RSI), at 52.08, suggests neutral momentum. The short-term overbought situations indicated by the stochastic oscillator readings of 72.60 (%K) and 79.37 (%D) may lead to profit-taking.
With barely 10.05 million coins moved compared to an average of 365 million—just 54.59% of typical activity—volume analysis shows alarming patterns. This decreased involvement points to traders’ hesitancy and market uncertainty. The cumulative selling pressure over recent periods is confirmed by the negative On-Balance Volume of -114.69 billion.
Solana Price Targets: Near-Term Pain, Long-Term Uncertainty
Depending on the timeline, analysts forecast different eventualities. The head-and-shoulders pattern estimates would be consistent with the monthly forecast objective of $52.30, which would indicate a 40% fall. Though the annual prediction predicts $203.12 by February 2027—a 133% gain that would still fall short of prior peaks—the quarterly view indicates a possible recovery to $142.85.
Important levels to keep an eye on are the important MVRV band support at $75 and the immediate support at $77 and $67. Sellers are anticipated to protect the area between the 20-day EMA at $104 and $95 on the upside. Bulls are resuming control if this zone is decisively closed above; they may target the 50-day SMA at $123.89.
The cryptocurrency is at a critical point where technical patterns, on-chain metrics, and market sentiment will determine whether buyers can establish a sustainable bottom or whether the bearish head-and-shoulders pattern will continue to play out. Solana has a market cap of $49.46 billion and has declined 56% annually.
- Check out our free forex signals
- Follow the top economic events on FX Leaders economic calendar
- Trade better, discover more Forex Trading Strategies
- Open a FREE Trading Account
- Read our latest reviews on: Avatrade, Exness, HFM and XM
Related Articles

Sidebar rates
Related Posts
