Bears Eye $60,000 as Liquidity Void and Institutional Mute Signal Deeper Correction
At $67,000, Bitcoin (BTC) is currently on the verge of collapse as market mood turns from cautious optimism to a conservative "wait-and-see"
Quick overview
- Bitcoin is currently priced at $67,000, facing a potential collapse as market sentiment shifts to a conservative stance.
- The cryptocurrency has struggled to maintain the $70,000 level, experiencing a 1.7% drop in the last day and over 4% since the week began.
- Analysts warn of a 'liquidity void' that could drag prices down to the $60,000 annual low, with significant selling pressure observed on major exchanges.
- Short-term predictions indicate a bearish trend unless Bitcoin can recover above critical resistance levels, while a bullish reversal requires breaking through the 20-day EMA.
At $67,000, Bitcoin BTC/USD is currently on the verge of collapse as market mood turns from cautious optimism to a conservative “wait-and-see” mentality. The leading cryptocurrency has struggled to stay over the crucial $70,000 threshold, falling 1.7% over the past day and more than 4% since the week began. Now, analysts caution that a “liquidity void” on the charts would serve as a gravity well, dragging prices down to the $60,000 annual low.
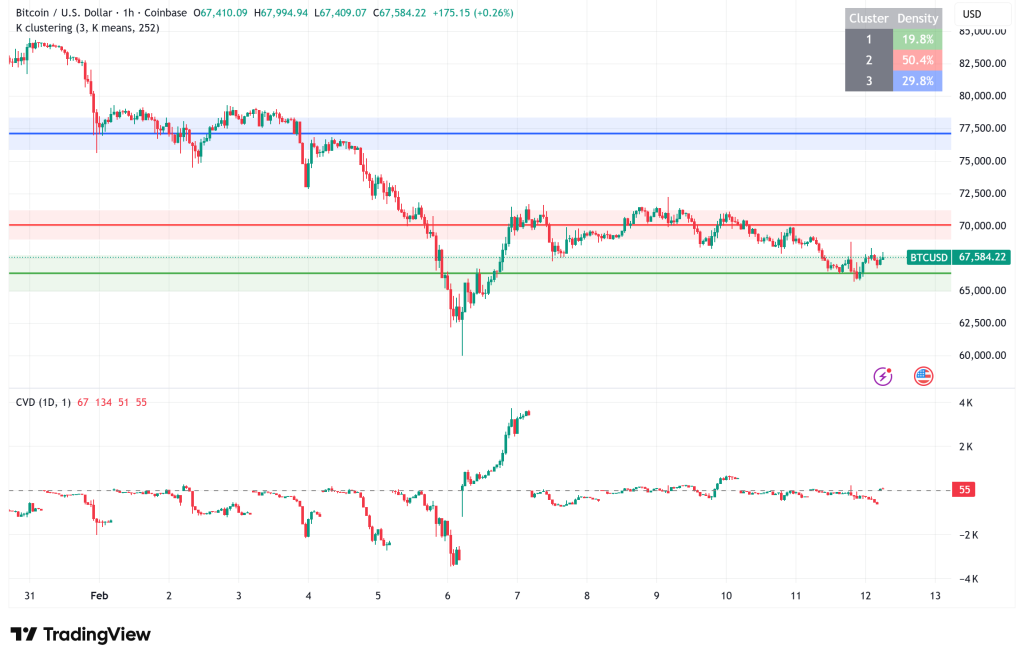
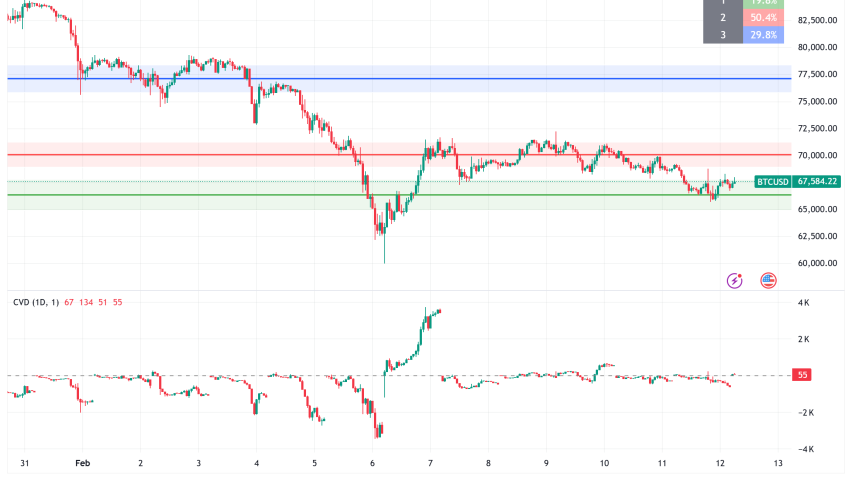
BTC/USD Technical Breakdown: Lower Highs and the “Liquidity Magnet”
The Bitcoin technical structure at the moment is becoming more pessimistic. Following several unsuccessful attempts to break through the $70,000–$72,000 resistance zone, Bitcoin has established a traditional sequence of lower highs on the hourly chart. Wednesday’s New York session featured a “swing failure pattern” in which aggressive selling reacted to a brief rally to $69,800, trapping breakout longs and quickening the decline below the 50- and 100-period exponential moving averages (EMAs).
Bulls are particularly concerned by the liquidity heatmap, which shows a large discrepancy between $66,000 and $60,500. This “void” indicates that there aren’t many purchase orders to protect the market from a decline, which could allow the price to move quickly in the direction of the next significant stop-loss cluster, which is located around $60,500. The last line of defense before a retest of the psychological $60,000 level is still a 15-minute order block that was discovered between $60,800 and $61,000.
Institutional Chill: Muted US Participation and Binance Selling
The pessimistic story is supported by on-chain measurements. The Coinbase Premium Index, which measures the price differential between offshore platforms and the US-regulated exchange, is still trapped in the negative zone. Given that domestic investors are hesitant to “buy the dip” at current levels, this suggests that institutional participation in the US is low.
At the same time, Binance, the biggest exchange globally in terms of volume, saw its Cumulative Volume Delta (CVD) fall to -$5.7 billion. It appears like “marginal sellers” on Binance are currently controlling the market’s course based on the ongoing net selling pressure. At around $2.8 billion, the 30-day “new money flow” has also turned negative, indicating that capital is leaving the ecosystem rather than returning.
Bitcoin Price Prediction: Defensive Zones vs. Recovery Scenarios
The short-term picture stays cautious as the Relative Strength Index (RSI) moves below 50 and oversold territory.
- The Bearish Path: A decline to $62,345 is probably in order if Bitcoin is unable to recover the $68,000 “anchored VWAP” (Volume Weighted Average Price) level. A high-volatility “assault” on $60,000 is what traders are anticipating. A daily closing below this mark might cause the trapdoor to open in the direction of $52,500.
- The Bullish Pivot: Buyers need to break through the 20-day EMA at $76,275 in order for a trend reversal to occur. The market has bottomed out, but only if it recovers steadily above the 50-day Simple Moving Average (SMA), which is at $85,830.
- Check out our free forex signals
- Follow the top economic events on FX Leaders economic calendar
- Trade better, discover more Forex Trading Strategies
- Open a FREE Trading Account
- Read our latest reviews on: Avatrade, Exness, HFM and XM
Related Articles


Sidebar rates
Related Posts
