Bitcoin Clings to $68K as Strategy Eyes 99th BTC Buy, On-Chain Indicators Point to $45K Floor
Bitcoin (BTC) is currently trading around $68,000, down 1.5% over the last day. With corporate buyers doubling down, short sellers being
Quick overview
- Bitcoin is currently trading around $68,000, down 1.5% over the last day, following a significant sell-off from February's peak of $60,062.
- Michael Saylor's company, Strategy, is preparing for its 99th Bitcoin transaction, despite facing financial strain and a stock price drop after reporting a $12.4 billion loss.
- The Cumulative Value Days Destroyed (CVDD) model indicates a potential price floor at $45,225, historically associated with significant market bottoms.
- Recent short liquidations totaling $736 million have occurred, but analysts caution that the rally lacks strong spot market conviction, indicating potential downside risks.
As the market navigates a precarious rebound from February’s devastating sell-off that briefly drove prices to $60,062, a near 50% decline from October 2025’s all-time high of over $126,000, Bitcoin BTC/USD is currently trading around $68,000, down 1.5% over the last day. With corporate buyers doubling down, short sellers being squeezed, and long-term on-chain models showing a possible floor at $45,225, sentiment is still sharply split.
Strategy Prepares Its 99th Bitcoin Transaction, Even as mNAV Collapses
Over the weekend, Michael Saylor, co-founder of Bitcoin treasury company Strategy (previously MicroStrategy), shared the company’s iconic BTC accumulation chart on X, which is a well-known indication that a new acquisition is about to happen. The forthcoming transaction would be the company’s 99th Bitcoin transaction on record and the 12th week of continuous weekly purchases.
With the addition of 1,142 BTC on February 9 for almost $90 million, Strategy’s total holdings now stand at 714,644 BTC, which is worth about $49.3 billion at current market pricing. With an average acquisition cost of almost $76,000 per coin, the business is now underperforming overall.
The ongoing buildup occurs under significant financial strain. Strategy’s stock price fell 17% in a single day after the company revealed a $12.4 billion Q4 loss. With a closing price of $133.88 on Friday, shares have partially rebounded. The strategy’s multiple on net asset value (mNAV), which is a crucial indicator of whether the market values the company higher than its cryptocurrency holdings, has fallen below 1.0 and is currently at 0.90, which is more worrisome for the treasury company model. Investors are generally discounting the company’s underlying assets when the mNAV is less than 1, which makes it more difficult for the company to issue shares on favorable terms to finance additional Bitcoin purchases.
CVDD On-Chain Model Flags $45,225 as the Cycle’s Structural Floor
The Cumulative Value Days Destroyed (CVDD) indicator, one of the most carefully monitored long-term valuation metrics in the Bitcoin market, is currently around $45,225, a level that has historically coincided with significant bottoms of Bitcoin cycles.
When long-dormant Bitcoin is eventually spent, CVDD tracks the cumulative historical value of “coin days destroyed,” a statistic that captures this event. CVDD efficiently maps the point at which that long-term confidence turns into selling, and uses that data to generate a price floor, because experienced holders typically sell close to market tops and re-accumulate during deep negative stages. The indicator has correctly identified the structural bottom of each significant bear cycle since 2012, including the low in 2015, the capitulation in 2018, and the sell-off in 2022 after the FTX collapse.
Although the present CVDD reading indicates the point at which deep-value accumulation has historically accelerated, it does not ensure that Bitcoin will drop to $45,225. Although the gap is closing in comparison to where BTC traded just months ago above $100,000, Bitcoin at $68,000 is still a significant distance above this floor, which some analysts interpret as an indication that the broader bull cycle is not yet fully capitulating. $736 million in shorts were liquidated, but the rally lacked spot market conviction.
$736 Million in Shorts Liquidated, But the Rally Lacks Spot Market Conviction
Last week, the Bitcoin futures market saw a massive short squeeze that eliminated almost $736 million in short positions on all major exchanges. This was the biggest liquidation event since September 2024, when $773 million in short positions were forcefully closed in one event.
Deeply negative funding rates on Binance and other platforms preceding the squeeze, indicating that traders had amassed an abnormally disproportionate bearish position. In a traditional liquidation cascade, those shorts were forcibly closed when prices rose from the bottom of $60,062 on February 6. This turned sell-side pressure into upward price momentum.
Analysts are wary about extrapolating too much from the rally, though. Thin liquidity is still evident in the spot market, which represents actual buy-and-hold demand from actual investors as opposed to leveraged speculation. Since November 2025, U.S. spot Bitcoin ETFs have been net sellers, losing almost $6.2 billion in net capital over that time. Any rise that is predominantly driven by short liquidations has the danger of fading once the derivative imbalance corrects, unless physical demand in the spot market starts to absorb supply more aggressively.
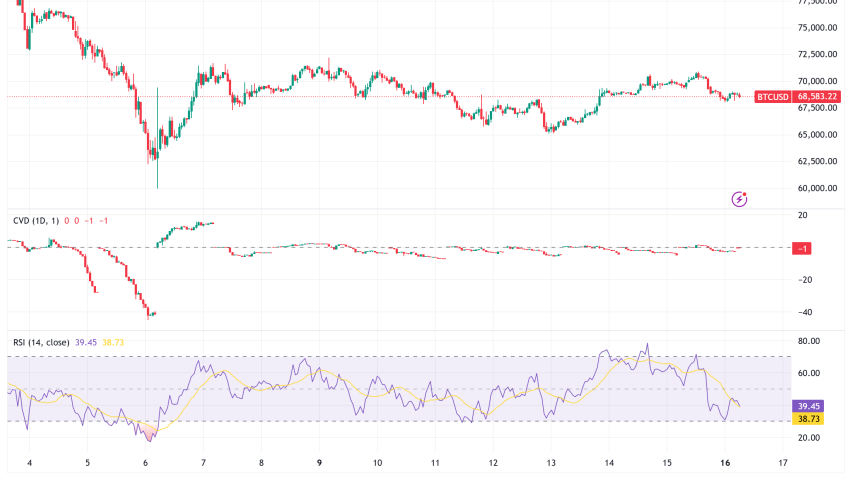
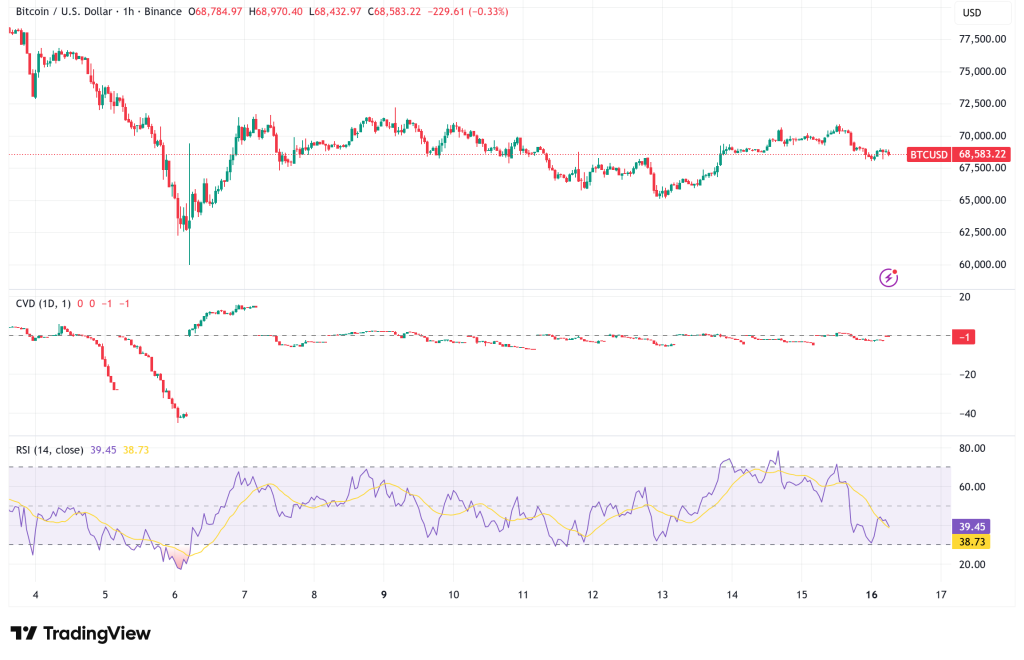
BTC/USD Technical Analysis: Bears Remain in Control Above a Critical Floor Zone
Right now, every significant technical indicator on the daily chart of Bitcoin is negative. Although it has historically preceded relief rallies, the Relative Strength Index (RSI), which has been ranging between 28 and 33, is not by itself a harbinger of a lasting reversal. Weeks ago, Bitcoin broke below its 365-day moving average, and since then, it has dropped over 23%. This loss is historically more severe than the bear phase that began in early 2022. Prior to the CVDD floor at $45,225, the 200-week moving average, which is located close to the $58,000–$60,000 range, serves as the final significant structural support.
Key Levels to Watch
- Immediate resistance: $75,000 — Polymarket prediction markets assign a 54% probability to BTC reaching this level by month’s end, which would require a roughly 10% move from current prices.
- Critical supply zone: $87,800–$92,950 — the anchored volume profile’s highest-momentum area from the previous bearish move. A reclaim of this range would shift the structural outlook significantly.
200-day EMA: approximately $95,700 — reclaiming this level is widely considered a prerequisite for any genuinely bullish trend resumption. - Support floor — 200-week MA: $58,000–$60,000 — the level from which BTC rebounded on February 6.
- Deep value floor — CVDD: $45,225 — the on-chain structural bottom; a move here would represent near-total cycle capitulation.
Bitcoin Price Prediction: Fragile Bounce With Downside Risk to $45K–$58K
Bitcoin has a short road ahead of it. If no additional macro catalyst, such a major change in Federal Reserve policy or resumed ETF outflows, amplifies selling pressure, a short-term relief rally toward $74,750–$75,000 is likely given the oversold RSI reading and the current short squeeze dynamics.
But as long as Bitcoin is below both the $87,800 supply zone and its 365-day moving average, the overall structural picture is still pessimistic. In the event of a prolonged downturn, Stifel analysts have projected a possible decline to $38,000, while the on-chain CVDD framework sets structural cycle support at $45,225. The most immediate significant line in the sand is the 200-week moving average, which is located between $58,000 and $60,000.
The ETF outflow statistics does not yet indicate a sustainable rebound, which would require Bitcoin to regain $90,000+ with significant spot market demand. Until then, it appears that the market is still recovering from the latter phases of a post-peak drop, and the February lows will probably be challenged once more before a strong bottom emerges.
- Check out our free forex signals
- Follow the top economic events on FX Leaders economic calendar
- Trade better, discover more Forex Trading Strategies
- Open a FREE Trading Account
- Read our latest reviews on: Avatrade, Exness, HFM and XM
Related Articles


Sidebar rates
Related Posts
