Bitcoin’s Accumulation Wave Confronts Bearish Sentiment: Why $80K is the Next Logical Target
Bitcoin (BTC) is again trading at about $68,000, exhibiting resilience. On-chain metrics and technical indicators are presenting a more
Quick overview
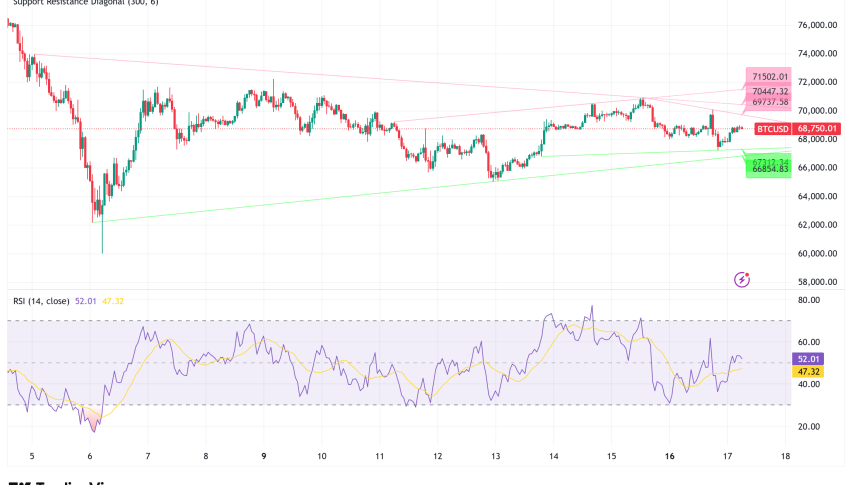
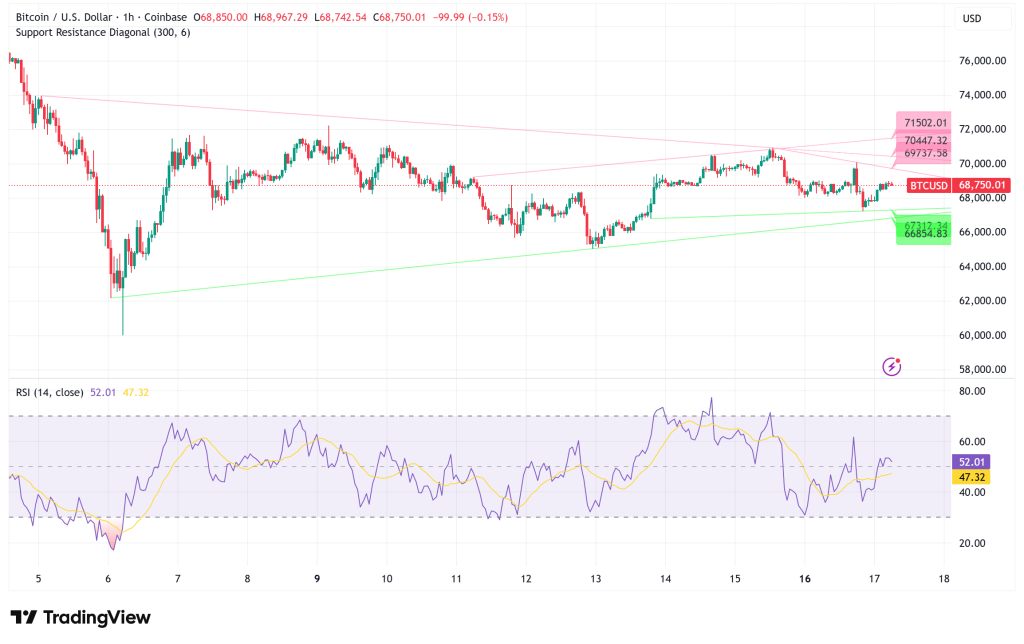
- Bitcoin is currently trading around $68,000 after a brief dip below $67,400, showing resilience amidst volatility.
- Accumulation addresses have significantly increased their Bitcoin holdings, indicating strong institutional conviction.
- Order book data reveals a strong bid support ratio, suggesting higher demand than supply, which could lead to price increases.
- Technical indicators and on-chain metrics point towards a potential price target of $80,000–$84,000 in the near future.
Following a tumultuous Monday session in which prices momentarily fell below $67,400 before rising again, Bitcoin BTC/USD is again trading at about $68,000, exhibiting resilience. On-chain metrics and technical indicators are presenting a more optimistic picture despite the short-term volatility, with analysts predicting a possible advance toward $80,000–$84,000 in the near future.
Accumulation Addresses Signal Strong Institutional Conviction
The sharp increase in Bitcoin holdings is among the most convincing evidence in favor of the bullish argument. As of Sunday, addresses categorized as “accumulators” held almost 372,000 Bitcoin, a startling increase from just 10,000 Bitcoin in September 2024, according to statistics from CryptoQuant. With the exception of exchange, miner, and smart contract wallets, these addresses satisfy stringent requirements such as multiple inflows, no outflows, minimum balance thresholds, and at least one active period during the last seven years.
There is less selling pressure from long-term holders (LTHs) during this accumulation wave. Compared to averages of over $1 million in November 2025, the 30-day LTH distribution total has dropped below $100,000, indicating that experienced Bitcoin investors are holding onto their assets rather than releasing them.
Order Book Data Reveals Strongest Bid Support in Two Years
The technical configuration is equally promising. Crypto trader Dom’s order book study reveals that, compared to just $297 million in asks, around $596 million in bids are situated between 0 and 2.5% of the current price levels. The biggest bid skew seen in more than two years is represented by this nearly 2:1 bid-to-ask ratio, which shows that demand is far higher now than supply is.
Generally speaking, such strong bid support serves as a basis for price increases, especially when maintained over time. According to the statistics, purchasing pressure has remained strong even after Monday’s turbulence, which resulted in the liquidation of $120 million in holdings across longs and shorts amid light holiday activity.
CME Gap Points to $80K-$84K Technical Target
One of the main technical goals, according to cryptocurrency researcher Mark Cullen, is the unfilled CME futures gap between $80,000 and $84,000. When Bitcoin futures markets close for the weekend and reopen at different prices, CME gaps are created, leaving ranges without any trading activity. In the past, Bitcoin has shown a significant propensity to “fill” these gaps; since August 2025, it has already filled nine out of ten CME gaps.
Along with other technical signs that point to upward momentum, the current gap is the most crucial unfilled level. Traders should take note, though, that Monday’s price activity, which was marked by “breakouts and shakeouts” according to Material Indicators, shows that the upward path could not be straight.
Extreme Short Positioning Creates Squeeze Potential
The current stance of the derivatives market supports the optimistic view. According to Santiment statistics, overall financing rates have fallen below -0.01% into extremely negative territory, suggesting that futures traders are generally in a bearish position. Since August 2024, when there was a significant bottom followed by an 83% rally over the next four months, there hasn’t been this amount of intense shorting.
Fear-based positioning is reflected in negative financing rates, which result in short sellers paying fees to long position holders. Extremely pessimistic attitude like this can lead to a short squeeze, in which even slight price increases push leveraged shorts to sell, increasing buying pressure.
Weekly RSI Signals Potential Bottoming Phase
Longer-term technical indicators also lend credence to a positive outlook. Monday saw the weekly Relative Strength Index (RSI) for Bitcoin hit 27.8, the lowest level since June 2022 and well below 30. Keith Alan, cofounder of Material Indicators, pointed out parallels to cycle lows in 2015, 2018, and 2022—all of which came before notable recoveries.
Extreme RSI readings imply that Bitcoin might be in a bottoming phase, but they do not ensure instant reversals. Since 2022 saw a five-month consolidation before setting a macro bottom, that comparison is especially pertinent.
Bitcoin Price Prediction: $80K-$84K in Near Term
Technical considerations, on-chain accumulation statistics, and derivatives positioning all point to Bitcoin being in a strong position to climb toward $80,000–$84,000 in the upcoming weeks. The large bid support and severe short positioning establish ideal conditions for upward momentum, while the unfilled CME gap offers a clear technical goal.
However, as Monday’s holiday trading showed, traders should continue to be aware of possible volatility. A strong closing above $75,000 would probably generate further momentum and possibly spark a short squeeze, which might hasten the rise toward the $80K–$84K level.
- Check out our free forex signals
- Follow the top economic events on FX Leaders economic calendar
- Trade better, discover more Forex Trading Strategies
- Open a FREE Trading Account
- Read our latest reviews on: Avatrade, Exness, HFM and XM
Related Articles


Sidebar rates
Related Posts
