Gold Braces for $6,300? Why the $5,150 Support is the Ultimate Battleground as Hormuz Risks Explode
The gold market is at a boiling point, caught in a high-stakes tug-of-war between the fear of global conflict and the headwind...
Quick overview
- The gold market is experiencing volatility due to escalating geopolitical tensions and a strong U.S. dollar, with spot gold trading around $5,158 an ounce.
- Recent conflicts involving the US, Israel, and Iran have heightened gold's appeal as a safe-haven asset, despite macroeconomic pressures.
- JP Morgan has raised its year-end gold price forecast to $6,300, driven by central bank purchases and a shift away from dollar assets.
- Analysts suggest that maintaining a close watch on key support levels and geopolitical developments will be crucial for gold's future price movements.
The gold market is at a boiling point, caught in a high-stakes tug-of-war between the fear of global conflict and the headwind of macroeconomic woes. As of March 4, 2026, spot gold is trading around $5,158 an ounce, having staged a +0.67% ($34) rebound after a rollercoaster session that saw prices hit a low of $5,095. While the metal has retreated from its recent peak near $5,400, the underlying bull market remains firmly intact as the Iran-US-Israel conflict enters a super-critical phase.
The “War Premium” vs. The Strong Dollar: a Tug-of-War that will go down to the wire
Gold’s price action lately has been a classic “safe-haven” response to a rapidly deteriorating regional situation.
- Conflict Escalation: Following US and Israeli strikes on Iranian leadership and military targets, Tehran has vowed to retaliate, which is leading to reports of troops being put on high alert and rising insurance premiums in the Strait of Hormuz
- The Dollar Headwind: Gold’s gains are being held back somewhat by a surging U.S. Dollar Index (DXY), which made its biggest one-day jump in a year recently. A stronger dollar is bad news for gold, as it makes the metal more expensive for international buyers.
- Energy Shock & Inflation: Brent crude has surged past $82, reviving fears of fuel-led inflation. While gold is a traditional inflation hedge, these spikes are prompting markets to downplay their bets on the Federal Reserve cutting interest rates aggressively, which increases the opportunity cost of holding non-yielding gold.
Technical Analysis: Testing the $5,150 Support & Finding out if it’s strong enough
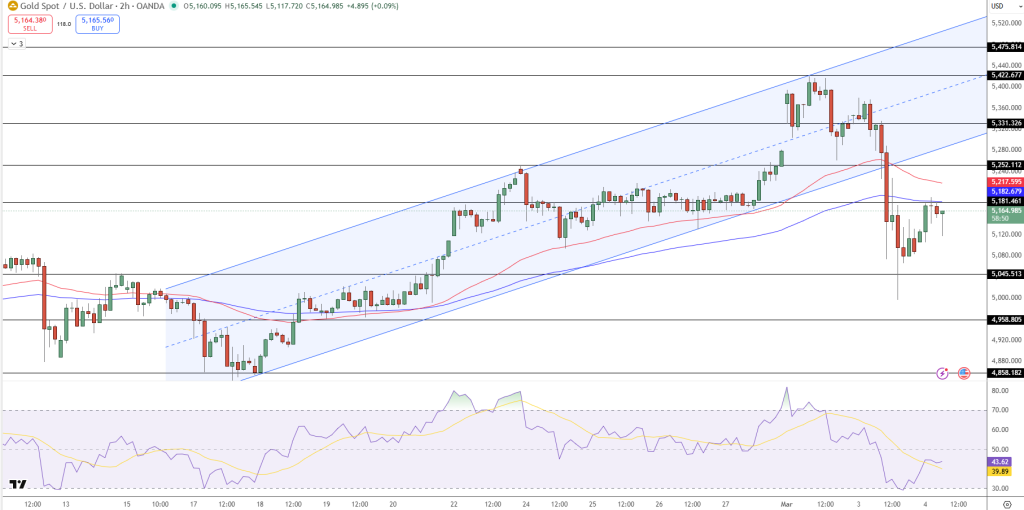
On the 2-hour chart, gold is looking a little tired after its parabolic run.
- The 100-EMA near $5,182 is like a Red Flag: if gold can’t get above this resistance level then the path to the $5,400-$5,600 zone is going to be a lot harder.
- Crucial Support is what’s going to keep gold from crashing: bulls are fighting hard to keep the $5,100-$5,130 zone intact. But if that does break down, then the next stop is the psychological floor at $5,045.
- Momentum is still hanging in there: the RSI is around 42, which is still outside of oversold territory, suggesting gold could still consolidate a bit before making its next move.
2026 Forecast: from $5,600 to $6,300 – and that’s not just a pipe dream
Despite some short-term chop, the institutional conviction in gold is at record levels.
- JP. Morgan Throws their Weight Behind $6,300: The bank just upped its year-end forecast to $6,300 an ounce, citing a “reserve currency paradigm shift”.
- Central Banks are Buying Gold like there’s no Tomorrow: Official sector buying is still a structural pillar, with J.P. Morgan forecasting 800 tonnes of central bank purchases in 2026, driven by emerging markets looking to diversify away from dollar-denominated assets.
- Upside Scenarios: Analysts at Bloomberg and UBS are saying that if the geopolitical risks persist, gold could hit $5,600 in the near term.
The Analysts Verdict: Navigating the Sea of Volatility
As someone who’s worked in this field for a while, I see this current drop as a breather in a structural uptrend. The market isn’t selling gold; it’s just building new long positions on every correction.
The Strategy: Keep a close eye on the Strait of Hormuz and US inflation data.
- Bullish Play: A weekly close above $5,182 would be a good sign, as that would target the $5,300 resistance.
- Bearish Play: A decisive break below $5,140 could send gold plummeting to $5,050, and that could be a secondary “dip-buying” opportunity.
- Check out our free forex signals
- Follow the top economic events on FX Leaders economic calendar
- Trade better, discover more Forex Trading Strategies
- Open a FREE Trading Account
- Read our latest reviews on: Avatrade, Exness, HFM and XM
Related Articles

Sidebar rates
Related Posts
