Ethereum Reclaims $2,000: Record Leverage and $273M Short Cluster Set Stage for Potential Breakout to $2,600
Ether (ETH) recovered the psychologically significant $2,000 threshold on Monday, trading close to $2,041 as major exchanges saw a huge
Quick overview
- Ether (ETH) has surpassed the $2,000 mark, trading around $2,041, with a 4.2% increase in the last day.
- A significant influx of over 110,000 ETH into derivatives platforms indicates heightened market activity and potential volatility.
- Institutional demand is bolstered by notable acquisitions, including 60,976 ETH by Bitmine, supporting a bullish outlook for Ethereum.
- Technical analysis suggests ETH is at a critical juncture, with potential targets of $2,249 if it maintains above key support levels.
Ether (ETH) recovered the psychologically significant $2,000 threshold on Monday, trading close to $2,041 as major exchanges saw a huge increase in derivatives market activity. The altcoin has increased by about 4.2% in the last day, surpassing the 3.77% increase in the overall market capitalization of the larger cryptocurrency market.
More than 110,343 ETH entered derivatives platforms on March 7, according to data from CryptoQuant, making it the third-largest single-day jump of 2026. The other significant comparable movement happened on February 6, when ETH increased by almost 13% from its annual low of $1,736. Traders on both sides of the market have historically been more prepared as a result of these increases in derivatives inflows, which often precede short-term drawdowns or times of extreme volatility.
Leverage Ratio Hits All-Time High of 0.78 — Amplifying Volatility Risk
Ether’s estimated leverage ratio increased to a record 0.78 on Wednesday, exceeding the previous cycle high of 0.778 on January 1, adding to the large inflows of derivatives. This measure, which tracks open interest in relation to exchange reserves, is frequently used to assess how aggressively traders are using borrowed funds.
A rating of 0.78 indicates a double-edged situation where a historically high percentage of open positions are leveraged. Cascading short position liquidations can increase upside momentum, but if the market reverses and long liquidations mount, it also increases downside risk. Explosive directional advances in either direction are made possible by the current configuration.
$273 Million Short Cluster Near $2,030 Acts as a Price Magnet
CoinGlass’s seven-day liquidation data shows a high concentration of short positions that are somewhat above the current price. Cumulative short-liquidation leverage of about $273 million is concentrated at $2,030. A rise into that area could set off a chain reaction of forced buybacks from overly leveraged short sellers, mechanically boosting upside momentum if it is reached quickly. Large concentrations of short liquidations often behave as magnetic price levels.
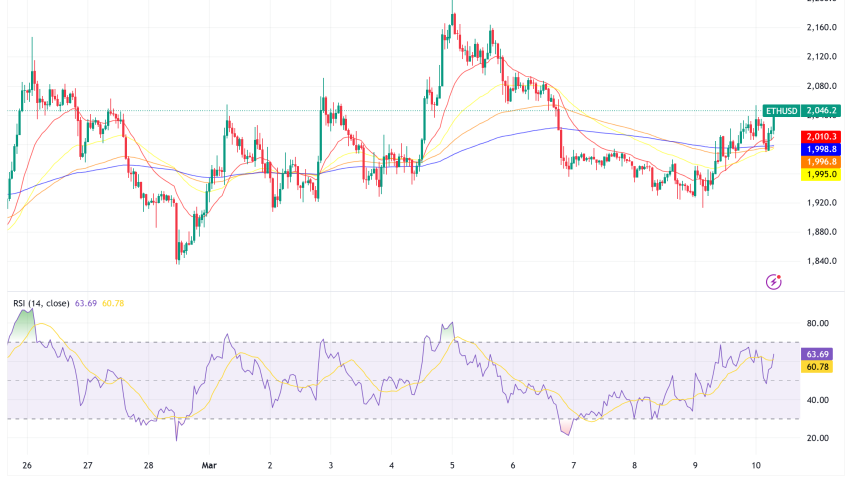
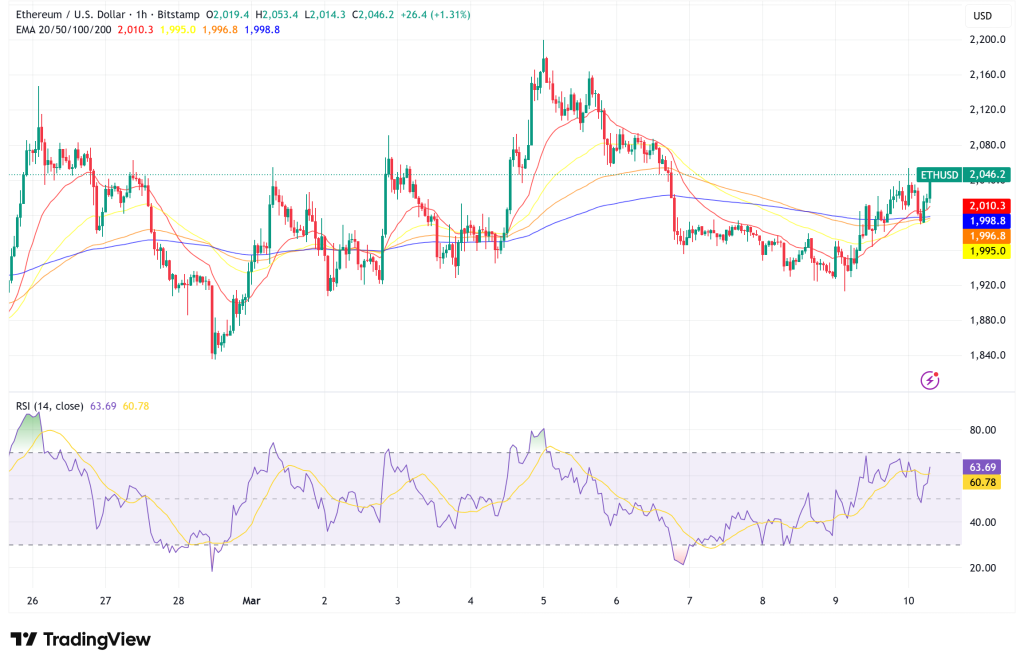
After a liquidity sweep around $1,908 on Sunday, the one-hour chart likewise printed a bullish pivot. After the altcoin’s swing failure pattern near $2,150 late last week, ETH is now aiming for the supply zone between $2,050 and $2,100. A decisive test of $2,150 and above might be made possible by a clear breakout above this area and its conversion into support.
Macro Tailwinds: G7 Oil Reserve Talks and Receding Inflation Fears
Ethereum’s action wasn’t unique. A macro relief trade, sparked by rumors that G7 energy ministers are actively discussing the release of strategic oil reserves to alleviate supply issues, was the main driver of Monday’s crypto-wide gain. With Bitcoin rising 5.4% and ETH closely following, the possibility of intervention reduced concerns that rising energy costs would necessitate a tighter-than-expected monetary policy reaction, improving sentiment across risk assets generally.
This was largely a rates-sensitive, liquidity-driven rally rather than a solely coin-specific trend, as evidenced by Ethereum’s strong correlation with Bitcoin’s daily increases. The U.S. Consumer Price Index (CPI) release on March 12 will serve as a test of the move’s sustainability; a hotter-than-expected print may quickly undo the macrotailwind that has driven cryptocurrency higher.
Institutional Demand Adds Fundamental Support: Bitmine and Ethereum Foundation
Visible institutional demand provided secondary but significant support. Under the direction of renowned market strategist Tom Lee, Bitmine Immersion Technologies revealed that it had acquired 60,976 ETH in the last week, indicating an accelerated rate of accumulation. News of an Ethereum Foundation collaboration with Bitwise for a 70,000 ETH staking project also surfaced.
While neither announcement was the primary trigger for Monday’s price action, the combination of big treasury buying and a high-profile staking programme confirms a bullish fundamental story for Ethereum at a technically important juncture. Even in the face of short-term uncertainty, institutional accumulation at these price points indicates belief in the long-term thesis.
ETH/USD Technical Analysis: Key Levels, EMA Structure, and Price Prediction
Technically speaking, ETH broke below its 20-day exponential moving average (EMA) on Friday at $2,018, but it was unable to move on to the $1,750 level. This was a negative signal that was soon disproved. It appears that buy-side interest is solidifying at lower levels since sellers were unable to withstand downward pressure. ETH is currently making an effort to recover and hold above the 20-day EMA.
At 56.8, the Relative Strength Index (RSI) shows neutral to slightly bullish momentum; it is not overbought and has potential for more gains. The neckline of a possible inverse head-and-shoulders pattern on the daily chart is represented by the immediate technical structure, which puts ETH in a squeeze between support at $1,900–$2,000 and a significant resistance zone at $2,160–$2,200.
Ethereum Price Outlook
- Bullish Case: The next significant target is the 50-day simple moving average (SMA) at $2,249 if ETH recovers and maintains above the 20-day EMA ($2,018) and breaks cleanly above the $2,050–$2,100 supply zone. Although sellers are anticipated to challenge that level, a consistent break above it opens the door to $2,600, especially if it is backed by a CPI figure that reassures on inflation. With a measured goal of $2,590, a clear close above $2,160 would validate the inverse H&S pattern.
- Bearish Case: The breakout effort fails and the pair is likely to stay stuck in its $1,800–$2,200 monthly range for a considerable amount of time if Ether reverses from the $2,111 resistance zone and breaks below $1,916. The likelihood of a retest of $1,800 would be greatly increased by a loss of the $1,900 level, particularly if the March 12 CPI data is disappointing.
- Check out our free forex signals
- Follow the top economic events on FX Leaders economic calendar
- Trade better, discover more Forex Trading Strategies
- Open a FREE Trading Account
- Read our latest reviews on: Avatrade, Exness, HFM and XM
Related Articles
Sidebar rates
Related Posts
