Silver Price Rout: Will the $61 Support Hold Against the Iran War Energy Shock?
The silver market is facing a tough period of economic uncertainty. On March 24, 2026, spot silver (XAG/USD) traded...
Quick overview
- The silver market is experiencing significant economic challenges, with prices dropping 45% from January's peak due to a strong US Dollar and industrial demand concerns.
- Technical indicators show a negative outlook for silver, with key support levels being closely monitored as prices fall below critical moving averages.
- Despite the paper market struggles, the physical supply of silver is limited, with a projected global supply deficit of 67 million ounces in 2026.
- Market sentiment is mixed, with institutional investors selling off silver while retail demand remains strong, particularly in India and China.
The silver market is facing a tough period of economic uncertainty. On March 24, 2026, spot silver (XAG/USD) traded between $67.34 and $68.49 per ounce, which is a sharp 45% drop from its January peak of $121.67. Gold has held up better, but silver has suffered more because it is both a safe-haven asset, now overshadowed by a strong US Dollar, and an industrial metal exposed to worries about falling demand due to the US-Israel-Iran conflict.
The closure of the Strait of Hormuz has sent Brent crude oil prices above $103 per barrel, raising concerns about global inflation. In response, the Federal Reserve has taken a tough stance, signaling only one rate cut for the rest of 2026. This has pushed real yields higher, making silver, which does not pay interest, a costly asset for large investors to hold.
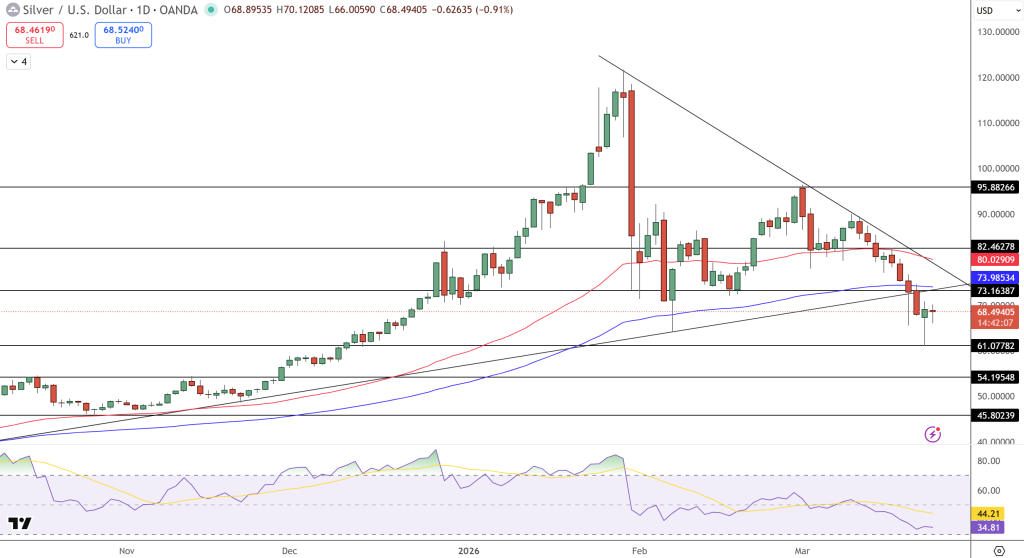
Silver Technical Outlook: The $73 Support Flips to Resistance
Short-term technical indicators for silver are now clearly negative. The recent drop below $73.16 was a major setback for those expecting prices to rise, since this level matched both the 200-day moving average and a long-term upward trendline. Now that the price is well below the 50-day moving average at $80.02, sellers have taken control of the market.
- Immediate Support: Analysts are closely watching the $61.07 support level, which was a key low point in early February. If silver falls below this level, it could quickly drop toward the next major support at $54.19.
- Momentum Indicators: The Relative Strength Index (RSI) is close to 34, which means silver is entering oversold territory. This sometimes leads to a short-term bounce, but the MACD is still below its signal line, so the trend is likely to remain downward for now.
- Recovery Targets: For the outlook to turn neutral again, silver needs to move back above $73.40, which is the 100-day simple moving average, and stay there.
The Sixth Consecutive Deficit: Why Fundamentals Tell a Different Story
Even though the paper market for silver is struggling, the actual supply of physical silver is still very limited. The Silver Institute reports that 2026 will be the sixth year in a row with a global supply deficit, with a shortfall expected to reach 67 million ounces. This ongoing shortage is caused by the technologies that are shaping this decade.
Although higher prices in 2026 have led the solar industry to use less silver per unit, demand from AI data centers, 5G networks, and electric vehicles is still growing quickly. High-performance GPUs and power systems are not very sensitive to price changes, so industrial users are still drawing from shrinking above-ground silver stocks, even at today’s prices.
Institutional “Wait and See” vs. Retail Accumulation
Market sentiment is divided. Institutional investors are selling silver to raise cash for margin calls as the stock market falls. Meanwhile, demand for physical silver in India and China is strong, with retail buyers seeing the $68 level as a rare buying opportunity.
The Gold-Silver Ratio has widened to 65:1, up from 59:1 earlier this year. In the past, when this ratio gets stretched during a correction, silver often outperforms gold in the recovery. Investors are now watching the March 27 PCE inflation data. If the numbers are lower than expected, it could trigger the “dovish pivot” needed to spark a big short-covering rally back toward the $80 resistance zone.
- Check out our free forex signals
- Follow the top economic events on FX Leaders economic calendar
- Trade better, discover more Forex Trading Strategies
- Open a FREE Trading Account
- Read our latest reviews on: Avatrade, Exness, HFM and XM
Related Articles


Sidebar rates
Related Posts
