Silver Price Forecast: $74.10 Under Pressure After Islamabad Talks Collapse – PPI and China GDP Decide This Week
XAG/USD is trading around $74.10 on April 13, 2026, down 2.23% after US-Iran peace talks in Islamabad broke down over the weekend...

Quick overview
- XAG/USD is trading at $74.10, down 2.23% following the breakdown of US-Iran peace talks and a US Navy blockade of Iranian ports.
- Rising oil prices, now above $100, are increasing inflation expectations and pressuring silver prices as the Fed is unlikely to cut rates soon.
- Silver's price is currently supported by a two-week ceasefire, but it dropped to an intraday low of $72.61 before recovering slightly.
- Key upcoming events include the US PPI report on April 14 and China's Q1 GDP on April 16, which could significantly impact silver demand and pricing.
XAG/USD is trading around $74.10 on April 13, 2026, down 2.23% after US-Iran peace talks in Islamabad broke down over the weekend and the US announced a Navy blockade of Iranian ports. Oil jumped more than 7.5% to $104–$105 on the news. Rising oil prices are putting pressure on silver through inflation concerns, and Tuesday’s PPI report will be the next key event.
Why Silver Fell Today: The Islamabad Paradox
At first glance, the weekend’s events seem surprising. An escalation in Hormuz would usually help a safe-haven metal like silver. However, silver dropped because of its unique mix of uses.
When oil trades above $100, it raises inflation expectations, pushes the Fed to keep rates higher for longer, strengthens the dollar, and lifts Treasury yields. This makes holding silver, which does not pay interest, less attractive. March CPI, released Friday, showed annual inflation rising to 3.3% from 2.4% in February, with a 0.9% monthly jump driven mainly by energy costs. The Fed is now seen as having no chance of cutting rates in April. Tehran’s refusal to give up its nuclear ambitions, as confirmed by Trump’s Truth Social post, makes a near-term ceasefire unlikely.
The two-week ceasefire is still technically in place, which means a diplomatic solution is still possible and helps limit further losses. Silver dropped to an intraday low of $72.61 before bouncing back to $74.10. For now, the ceasefire acts as the main support preventing a deeper fall below $72.
Silver Technical Analysis: Ascending Structure vs. Macro Headwind
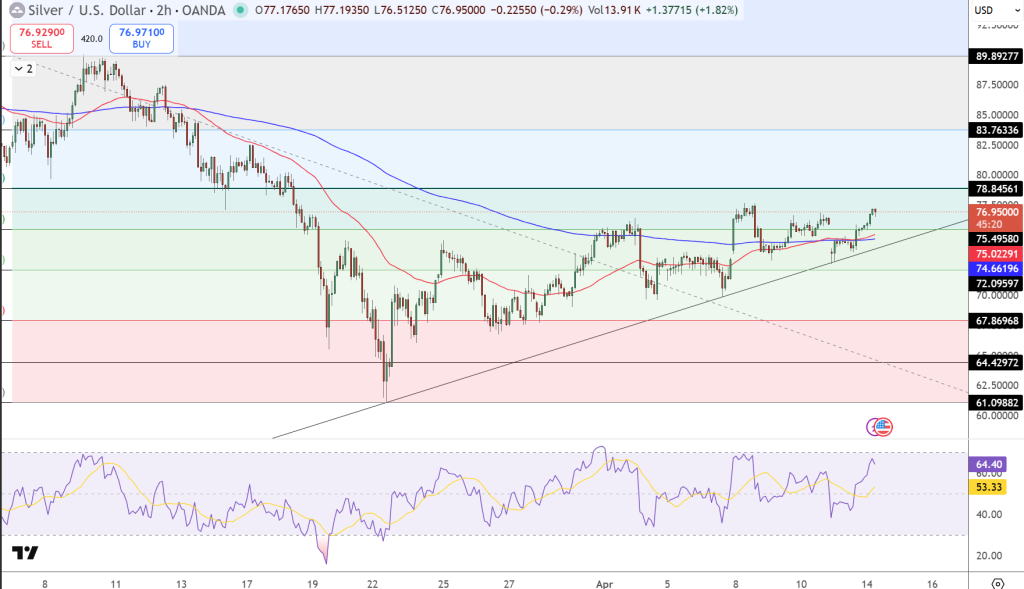
The 2-hour chart shows an upward trendline from the late-March low that is still holding, but today’s gap-down open is putting it to the test.
Price is near the 200 EMA (about $74.66), which is the closest support level. The 50 EMA (around $75.02) sits just above and will be the first resistance if price recovers. Both EMAs have flattened, showing the market is moving from a downtrend into a consolidation phase, as the chart suggests.
Resistance: $75.50 → $77.00 (breakout trigger) → $78.85 (major target). Support: $74.60 (200 EMA) → $72.10 (structural floor) → $70 (bear case if macro deteriorates).
Before today’s open, the RSI on the 2-hour chart was moving toward 60–65, which pointed to growing bullish momentum. However, the gap-down has reset that signal. The trendline will remain valid as long as $74.50 is not broken on a daily close.
Main trade idea (bullish if price stays above the EMAs): Buy if price breaks above $77.00, aiming for a target of $78.85, with a stop if it falls below $74.50. For a dip entry, consider buying near $75.50 if the trendline is retested, using the same target and stop.
This Week’s Catalysts: PPI Tuesday, China GDP Thursday
Tuesday – US PPI (April 14): According to FXStreet, this could be the most important inflation report because of the recent oil spike. If March PPI rises like CPI did, markets will likely rule out any 2026 rate cuts, which would strengthen the dollar and put more pressure on silver.
Thursday – China Q1 GDP, retail sales, and industrial production (April 16): China is the biggest industrial user of silver. If Q1 GDP is strong, it would show ongoing demand from AI data centers, solar manufacturing, and EVs, which are the main reasons for the Silver Institute’s forecast of a 67-million-ounce deficit in 2026. If the numbers disappoint, worries about industrial demand will grow and could hurt silver more than gold.
FAQ: Silver April Outlook — Islamabad Collapse, PPI Risk, and the $78 Target
Why is silver dropping even as Middle East tensions rise?
More than half of silver’s demand comes from industry, so it reacts more to growth and inflation signals than gold does. Higher oil prices from the Hormuz blockade raise inflation expectations, push up Treasury yields, strengthen the dollar, and make holding silver less attractive. These factors are currently stronger than the safe-haven effect.
What does Tuesday’s PPI mean for silver?
PPI tracks inflation at the producer level. If it rises like March CPI did, markets will likely rule out any 2026 Fed rate cuts, which would strengthen the dollar and put more pressure on silver. If PPI is lower, rate-cut hopes could return, the dollar could weaken, and silver might quickly rebound toward $76–$77.
What is the silver price target if the $77 breakout holds?
The first technical target is $78.85, which matches a major resistance area from previous supply. If silver moves higher, the next level is $83.70. JP Morgan forecasts an average price of $81 for 2026, Bank of America targets $135, and Citigroup expects $150–$170 in the second half. The ongoing supply deficit of 67 million ounces for the sixth year in a row provides a strong support level against any macro-driven drop.
- Check out our free forex signals
- Follow the top economic events on FX Leaders economic calendar
- Trade better, discover more Forex Trading Strategies
- Open a FREE Trading Account
- Read our latest reviews on: Avatrade, Exness, HFM and XM
Related Articles


Sidebar rates
Related Posts
Ava

