Can USD/JPY Break the 50 Daily SMA This Time?
USD/JPY has been bullish in September. But it reversed lower this week and now it is facing the 50 SMA as support
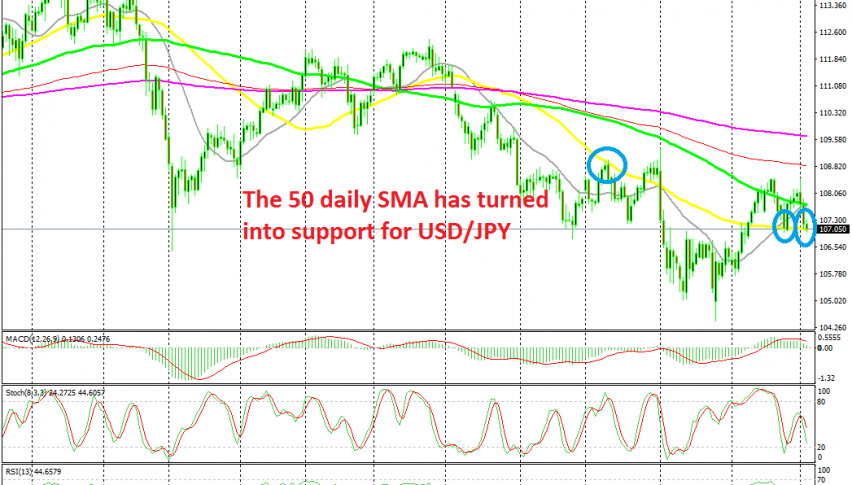
[[USD/JPY]] has been on a bearish trend since December last year as the global economy kept weakening and the sentiment kept deteriorating in financial markets, which turned the attention of traders towards safe havens. After a retrace higher during Q1 of this year which came after the sentiment improved a bit, the downtrend resumed again and smaller moving averages such as the 20 SMA (grey) and the 50 SMA (yellow) were pushing the price lower on the daily chart.
The sentiment improved again in financial markets in September due to some positive comments from US and China, and we saw another retrace higher last month. But, we have seen a bearish reversal in the last three days after the US ISM manufacturing PMI fell deeper into contraction on Tuesday.
The price has declined around 160 pips so far, but USD/JPY is facing the 50 SMA (yellow) now. This moving average turned from resistance into support in the last week of September.
Now the price is back here, facing the 50 SMA for the second time in two weeks. We will now see if the sellers will finally break this moving average. If they do, then the larger bearish trend will resume.
- Check out our free forex signals
- Follow the top economic events on FX Leaders economic calendar
- Trade better, discover more Forex Trading Strategies
- Open a FREE Trading Account
- Read our latest reviews on: Avatrade, Exness, HFM and XM
Related Articles


Sidebar rates
Related Posts
