AUD/USD Faces Some Major Obstacles on the Daily Chart as it Climbs Higher
AUD/USD moved higher yesterday as the sentiment improved on a partial US-China trade deal comments
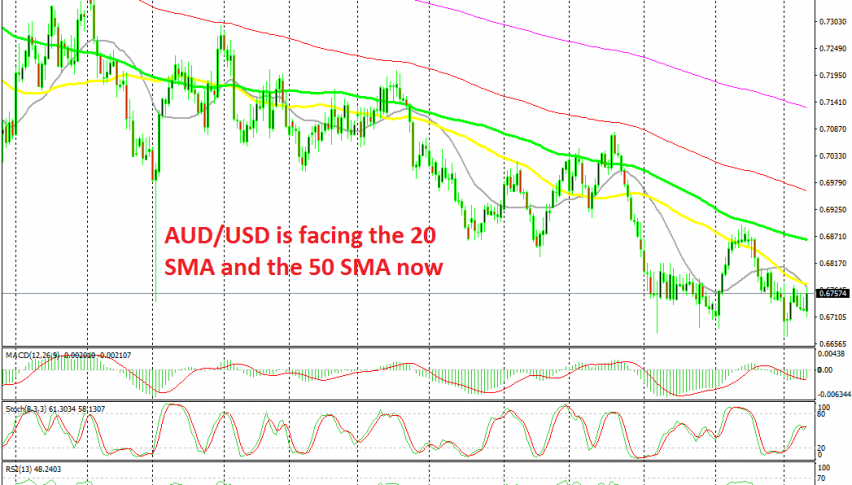
[[AUD/USD]] has been on a bearish trend since January 2018. During this time, AUD/USD has lost around 15 cents from top to bottom. We have seen the price retrace higher many times, but they have all ended at moving averages on the daily chart.
When the trend has not been very strong, the larger period moving averages such as the 100 simple or smooth (green and red) MAs have provided resistance. When the trend has picked up pace, the smaller moving averages such as the 20 SMA (grey) and the 50 SMA (yellow) have taken their place.
On October 1, this pair lost around 100 pips, but the price formed a pin the next day and we saw a reversal follow up since then. Yesterday we saw a big bullish candlestick on the daily chart, but buyers ran into the 20 and 50 SMAs and the price pulled back down.
The daily candlestick still closed pretty bullish, but the moving averages remain and they will be a tough obstacle for this pair. Although, if the US and China reach even a partial deal, I assume that the bulls will be in charge for some time.
- Check out our free forex signals
- Follow the top economic events on FX Leaders economic calendar
- Trade better, discover more Forex Trading Strategies
- Open a FREE Trading Account
- Read our latest reviews on: Avatrade, Exness, HFM and XM
Related Articles


Sidebar rates
Related Posts
