Selling USD/JPY on a Bearish Chart Setup
USD/JPY went through a rough time yesterday. It tumbled more than 100 pips top to bottom as the USD crumbled after the FED rate hike
- The Fall
USD/JPY went through a rough time yesterday. It tumbled more than 100 pips top to bottom as the USD crumbled after the FED rate hike. You’d expect this forex pair to take off when the FED increases interest rates, but forex is never straightforward.
- The Weak Retrace
However, late in the evening the sellers unloaded some of their sell positions and this pair started to reverse. It has been retracing higher since then, albeit the retrace seems weak. USD/JPY has only reclaimed about 40 pips in the last couple of trading sessions.
This sort of price action tells us that the sellers remain in control. The retrace is weak and the trend is down on the hourly timeframe chart.
- The Forex Trade
So, we decided to open a sell forex signal up here. As you can see from the hourly chart, the area around 112.85-90 has provided resistance last week. Now, it looks as it is turning into resistance.
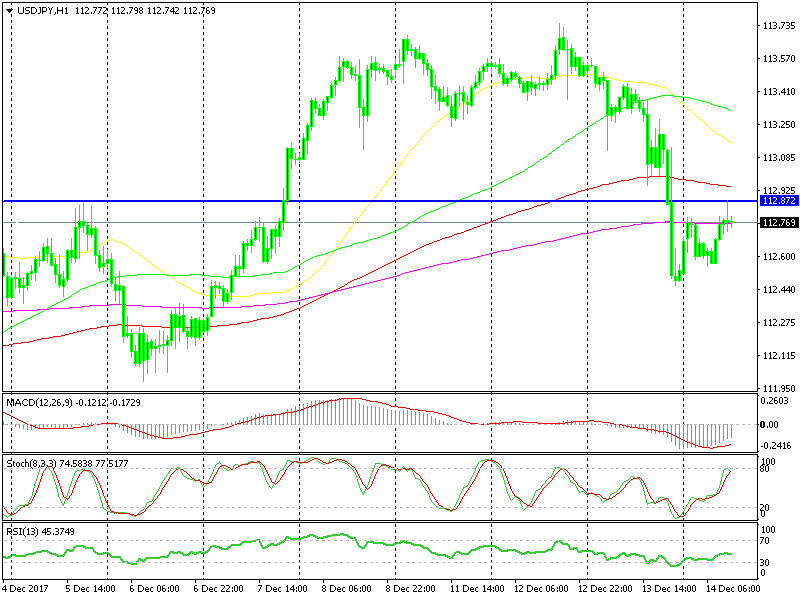
The retrace up should be over soon
The stochastic indicator is overbought as well, which means that the retrace up is over on this chart. Another bearish sign is the last candlestick which closed as a doji. A doji is a reversing signal after a short term trend such as the uptrend we have seen overnight in this foerx pair.
The 100 (red) and particularly the 200 (purple) moving averages are also in favour of the sellers. They are scaring the buyers, so hopefully the retrace will be over soon and we will see another push down from the sellers.
- Check out our free forex signals
- Follow the top economic events on FX Leaders economic calendar
- Trade better, discover more Forex Trading Strategies
- Open a FREE Trading Account
- Read our latest reviews on: Avatrade, Exness, HFM and XM
Related Articles


Sidebar rates
Related Posts
