Bitcoin Faces the 20 SMA Now, After Breaking Above the Trend Line
Bitcoin stopped declining at the 100 weekly SMA and has bounced off of it, pushing above the descending trend line
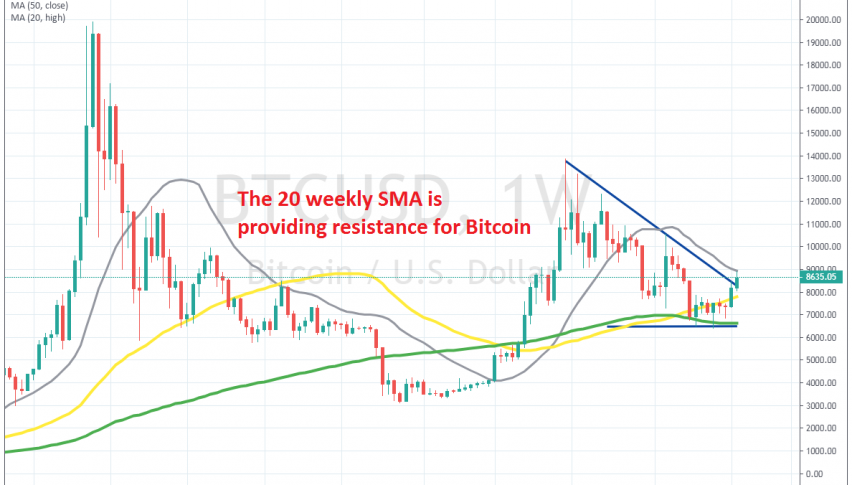
BITCOIN turned bearish in Q3 of last year, after surging more than $10,000 higher in Q2. It has remained bearish since then and at the end of last year it made some new lows, falling below $7,000. During this time, the 20 SMA (grey) turned into resistance for Bitcoin on the weekly chart.
A descending trend line formed in Bitcoin, connecting the highs which were getting lower. But, the 100 SMA (green) turned into support for this cryptocurrency, holding strong for several weeks. In the last two weeks, we have seen a bullish reversal and a jump from the 100 SMA, after the pin candlestick.
That shows that lows are getting higher on the larger picture, so the larger trend remains bullish. Buyers pushed above the descending trend line, which is another bullish sing, but the 20 SMA is now providing resistance. If the 20 SMA is broken, then the buyers will be in full control. Otherwise, we might see a pullback down before the next push higher.
- Check out our free forex signals
- Follow the top economic events on FX Leaders economic calendar
- Trade better, discover more Forex Trading Strategies
- Open a FREE Trading Account
- Read our latest reviews on: Avatrade, Exness, HFM and XM
Related Articles


Sidebar rates
Related Posts
