USD/CAD Breaks Below the 20 Daily SMA and 1.40, as Oil Remains Steady
USD/CAD has now broken below the 20 SMA on the daily chart, as markets expect OPEC+ to cut production by 10 million barrels/day
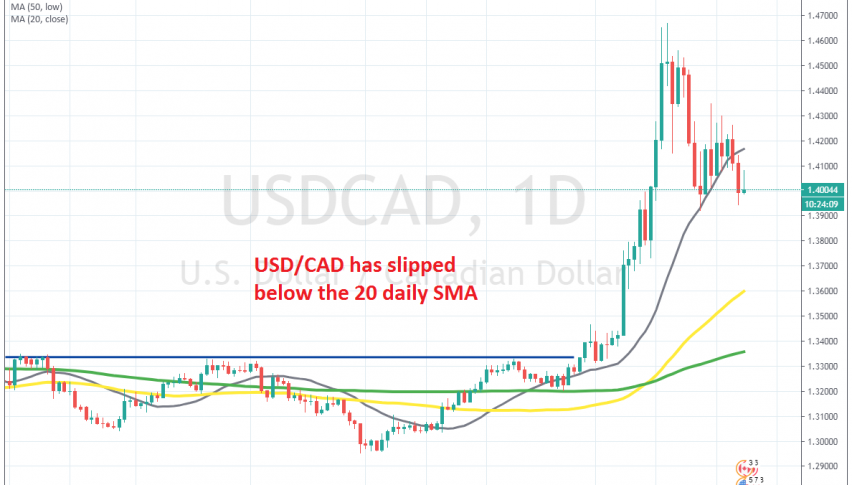
[[USD/CAD]] surged around 15 cents higher in less than a month, starting from the last week of February. That was for a couple of reasons; first, the USD surged as traders turned to it as a world reserve currency and second, because Crude Oil crashed lower and we know that the CAD is closely correlated to Oil prices.
But, the price formed a doji at the top, right below 1.47, which is a reversing signal after the climb. The USD retreated in the following week and USD/CAD fell below 1.40, reaching 1.3920s, where it met the 20 SMA (grey) on the daily time-frame, which provided solid support.
Seems like sellers were giving up right at this moving average and the 20 SMA kept pushing the price higher. But, the risk sentiment has improved in the last two days and risk currencies such as CAD have benefited. Then, Crude Oil surged last Friday, after rumours for a 10 million barrels/day cut in Oil production from OPEC+.
Russia has accepted to join the OPEC+ meeting on Thursday, so we’ll see how it goes. Although, it has been enough to turn USD/CAD bearish and send it down again. Now the 20 SMA has finally been broken properly and the price has slipped below 1.40. If OPEC+ decides to make a large cut, then the downside should stretch further for this pair.
- Check out our free forex signals
- Follow the top economic events on FX Leaders economic calendar
- Trade better, discover more Forex Trading Strategies
- Open a FREE Trading Account
- Read our latest reviews on: Avatrade, Exness, HFM and XM
Related Articles


Sidebar rates
Related Posts
