The 20 SMA is Playing with USD/JPY
Earlier today I was looking at the daily chart of USD/JPY. I spotted that the surge last Friday stopped right at the 20 SMA (grey).
usd/jp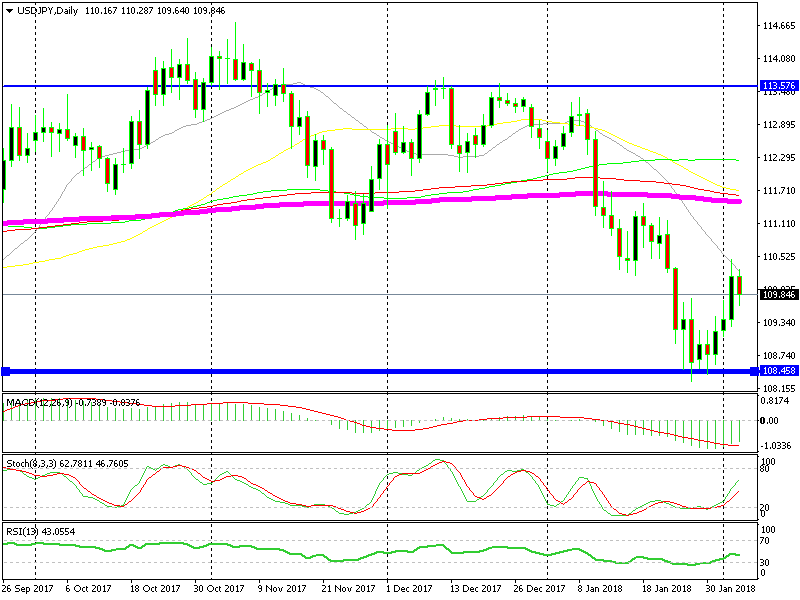
The climb stopped right at the 20 SMA
We can say that the 20 SMA is capping the top side on this forex pair. That’s on the daily chart. If we switch on the H4 chart, we can see that the same moving average is providing support.
USD/JPY was sliding this morning but the 20 SMA was standing in the way on the H4 timeframe chart. The price just touched the 20 SMA and then pulled back higher. So, the 20 SMA provided support.
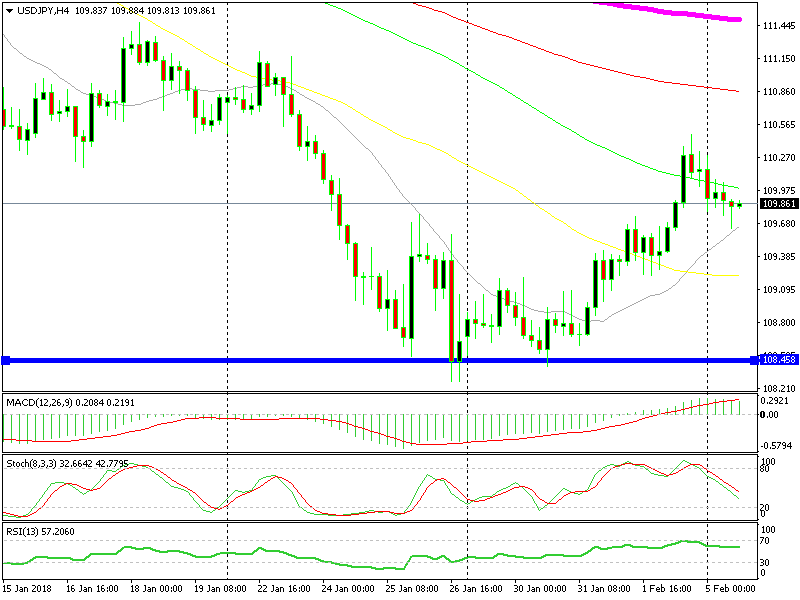
The 20 SMA is providing support on this timeframe chart
I was looking to open a buy forex signal here, but I wanted to see the sellers reach 109.50 first. Or perhaps, reach 109.20s where the 50 SMA (yellow) awaits.
The previous H4 candlestick closed as a hammer, which is a reversing signal after today’s downtrend. So, the picture has turned bullish now and we’re still thinking about opening that buy signal. But, I would prefer a better entry price lower. So, I will wait for the sellers to have another go at the 20 SMA on the H4 chart and will try to buy down there.
- Check out our free forex signals
- Follow the top economic events on FX Leaders economic calendar
- Trade better, discover more Forex Trading Strategies
- Open a FREE Trading Account
- Read our latest reviews on: Avatrade, Exness, HFM and XM
Related Articles


Sidebar rates
Related Posts
