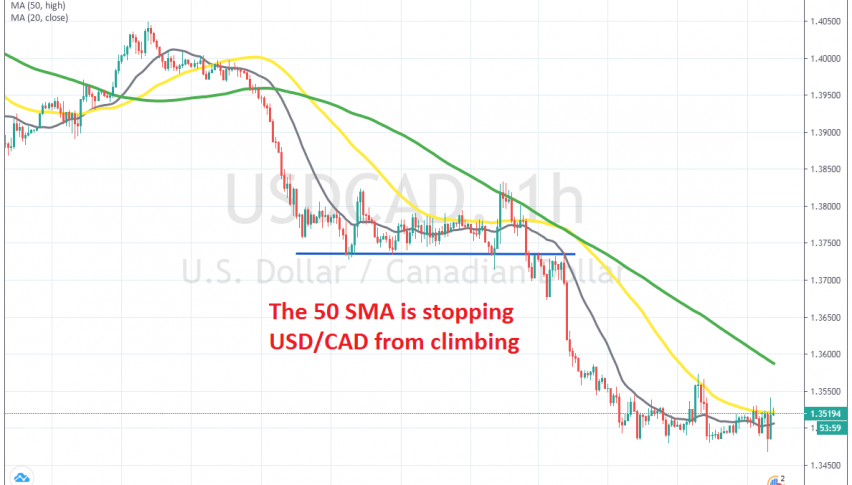
USD/CAD Continues to Find Resistance at the 50 SMA
USD/CAD is trying to retrace higher, but the 50 SMA is still stopping it
[[USD/CAD]] retraced around 8 cents lower during the end of March, after a 15 cent surge in the previous few weeks. But the decline stopped by the middle of April and this pair formed a support zone around 1.3850s, which kept this pair above for about two months.
During that period, highs were getting lower, which was a sign that sellers were stronger than buyers. Eventually, the support zone was broken and USD/CAD declined more than 350 pips lower, as Crude Oil turned bullish. In the first few days of this week, the 20 SMA (grey) was providing resistance at the top, with the decline being quite fast.
But, the decline slowed and the 50 SMA (yellow) caught up with the price on the H1 chart. That moving average has provided resistance in the last few days and we did get a trade in this pair, selling at the 50 SMA on Tuesday. Now USD/CAD is trading around this moving average again, having difficulty standing above it. We might open another sell signal here, so follow our signals session for the next few hours.
- Check out our free forex signals
- Follow the top economic events on FX Leaders economic calendar
- Trade better, discover more Forex Trading Strategies
- Open a FREE Trading Account
- Read our latest reviews on: Avatrade, Exness, HFM and XM