EUR/GBP Bounces But Still Trades Between MAs
EUR/GBP has formed a head and shoulders pattern on the H4 chart, but the 50 SMA is still holding
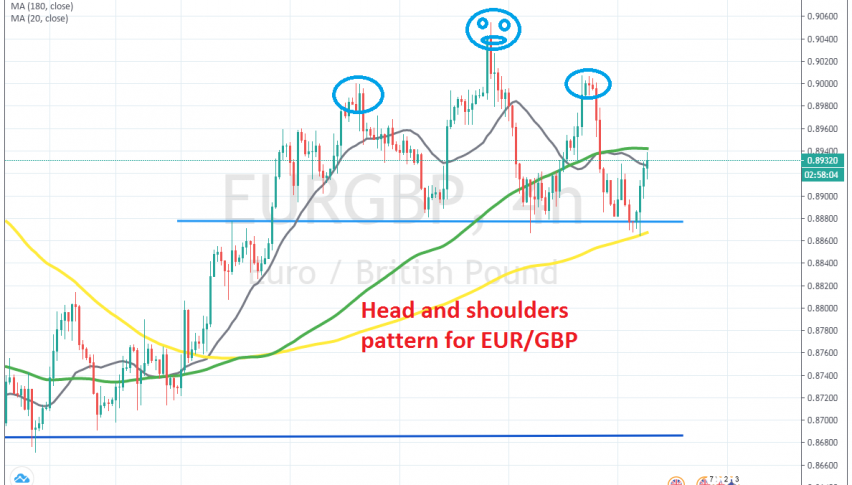
EUR/GBP surged around 12 cents higher in the first half of March, but stopped climbing at 0.95 and reversed down, losing around 7-8 cents in the next couple of weeks. This pair traded in a 200 pip range for several weeks, but then broke out to the upside.
The price climbed up to 0.9050 during May but then stalled up there and reversed back down. Looking at the H4 chart, we see that this pair has formed a head and shoulders chart pattern. This pattern points to a bearish move lower, which should take this pair to the bottom of the previous range at around 0.8780.
Although, the 50 SMA (yellow) held well as support on the H4 chart. EUR/GBP bounced off this moving average earlier today, but is now facing the 100 SMA (green). If the 100 SMA holds as resistance for this pair, then the head and shoulders pattern might play out. But, first the neckline has to be broken.
- Check out our free forex signals
- Follow the top economic events on FX Leaders economic calendar
- Trade better, discover more Forex Trading Strategies
- Open a FREE Trading Account
- Read our latest reviews on: Avatrade, Exness, HFM and XM
Related Articles


Sidebar rates
Related Posts
