Retail Sales Cool Off Further in July
US retail sales posted a 1.2% increase in July
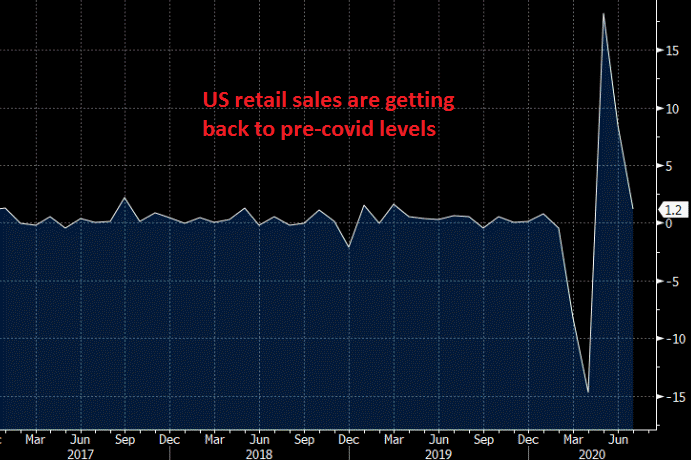
Retail sales took a plunge in March by 8.7% for headline sales and by 4.5% for core sales. The decline got much bigger in April, as they did in Europe as well, due to the lock-downs, with core sales posting a 17.2% plunge and headline sales declining by 16.4%. Although, they reversed in May, posting a very strong increase, which cooled off in June, but still remained pretty strong. Today’s report is showing another cool-off, but for such times, the increase is considerable nonetheless:
July 2020 US Retail Sales Report
- July advance retail sales +1.2% vs +2.1% expected
- Prior was +7.5% (revised to +8.4%)
- Ex autos and gas +1.5% vs +1.0% expected
- Prior ex autos and gas +6.7% (revised to +7.7%)
- Ex autos 1.9% vs +1.3% expected
- Control group +1.4% vs +0.8% expected
- Prior control group +5.6% (revised to +6.0%)
- Sales +2.7% y/y % vs +1.1% prior
- May-July sales down 0.2% from the same period a year ago
The details of this report are much stronger than the headline and the revisions were significant.
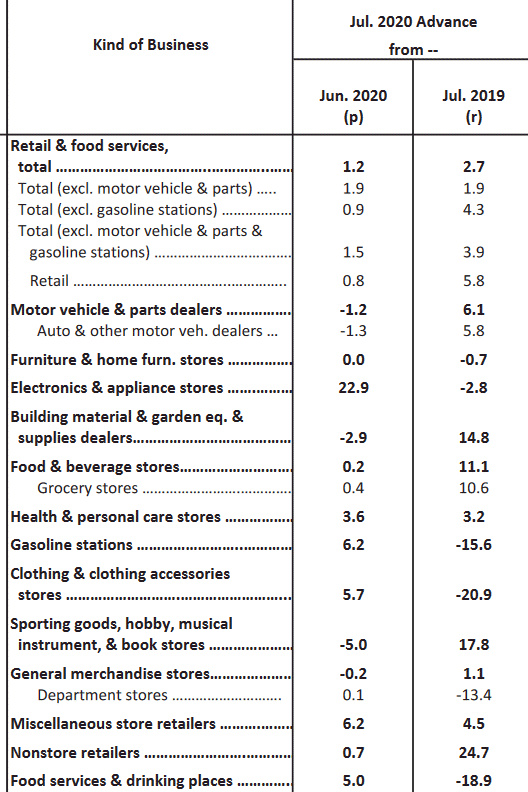
That said, headline aggregate retail sales are now 1.2% higher than the January peak — while the control group is 7.3% higher over the same time window. 9 of 13 categories rose in July, versus 11 in June and all 13 in May; the two biggest contributions to sales were eating and drinking (+0.49%) and gasoline stations (+0.41%). Overall, evidence that consumption remains in reasonable shape given the lockdown realities of the pandemic.
- Prior was +7.5% (revised to +8.4%)
- Ex autos and gas +1.5% vs +1.0% expected
- Prior ex autos and gas +6.7% (revised to +7.7%)
- Ex autos 1.9% vs +1.3% expected
- Control group +1.4% vs +0.8% expected
- Prior control group +5.6% (revised to +6.0%)
- Sales +2.7% y/y % vs +1.1% prior
- May-July sales down 0.2% from the same period a year ago
The details of this report are much stronger than the headline and the revisions were significant.
That said, headline aggregate retail sales are now 1.2% higher than the January peak — while the control group is 7.3% higher over the same time window. 9 of 13 categories rose in July, versus 11 in June and all 13 in May; the two biggest contributions to sales were eating and drinking (+0.49%) and gasoline stations (+0.41%). Overall, evidence that consumption remains in reasonable shape given the lockdown realities of the pandemic.
- Check out our free forex signals
- Follow the top economic events on FX Leaders economic calendar
- Trade better, discover more Forex Trading Strategies
- Open a FREE Trading Account
- Read our latest reviews on: Avatrade, Exness, HFM and XM
Related Articles


Sidebar rates
Related Posts
