Buying USD/JPY Above the 50 SMA
USD/JPY has retreated lower, but the 50 SMA should hold a support again
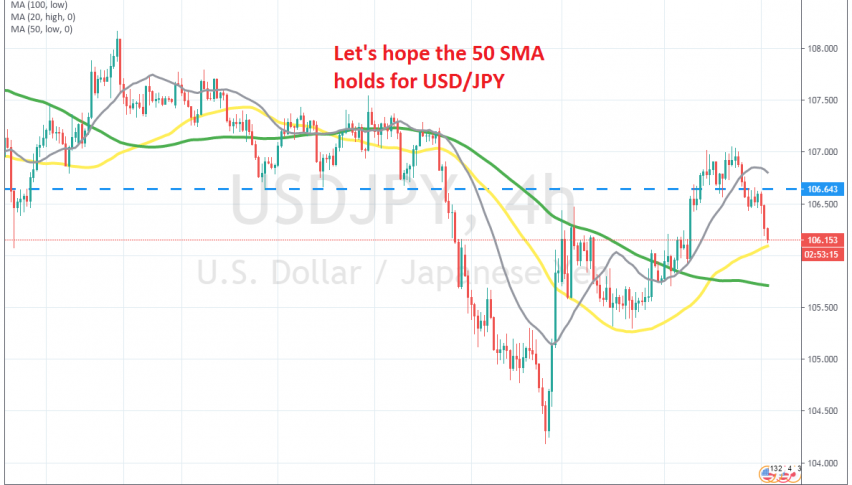
[[USD/JPY]] has been on a bearish trend since late March, when the roller-coaster ride which sent this pair tumbling 11 cents lower and then reversing 10 cents higher ended. The trend hasn’t been strong, but the pressure was on the downside for this forex pair.
The downtrend picked up pace in the last week of July though, as the USD went through another phase of weakness. USD/JPY lost another 300 pips during that decline, falling to 104.20. But the situation reversed in the last day of July and USD/JPY turned bullish for a couple of weeks, as the demand for safe havens cooled off a little.
The price climbed above 107 once again, but has retreated around 100 pips lower in the last few trading days. USD/JPY is 100 pips lower now, but the 50 SMA (yellow) should hold as support now. This moving average has provided support during previous pullback lower, in the first week of this month, so we are hoping to see a bounce from the 50 SMA. We bought USD/JPY a while ago by the way.
- Check out our free forex signals
- Follow the top economic events on FX Leaders economic calendar
- Trade better, discover more Forex Trading Strategies
- Open a FREE Trading Account
- Read our latest reviews on: Avatrade, Exness, HFM and XM
Related Articles


Sidebar rates
Related Posts
