Gold Facing the 50 SMA, as it Crashes Down
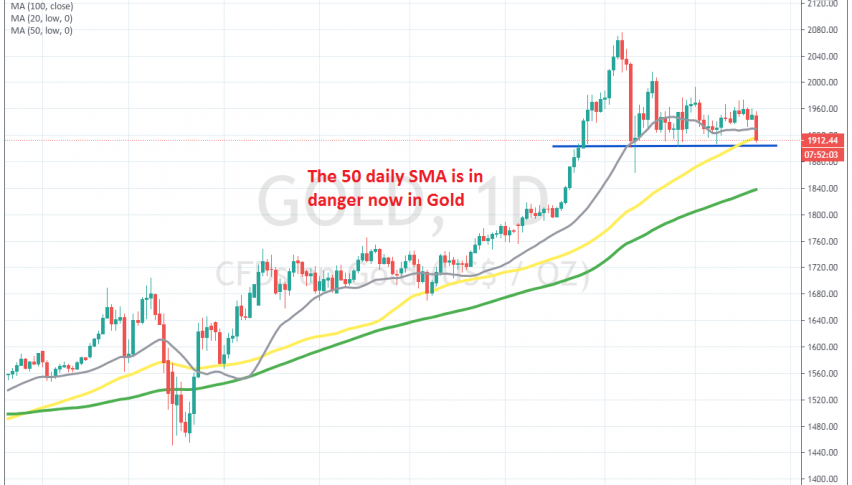
Gold has just slipped below the 50 SMA on the daily chart
GOLD has been really bullish for a couple of years now, since it reversed higher in September 2018. We saw a deep dive in early March, to the tune of $ 250, but the precious metal shrugged off those losses and resumed the uptrend soon after, making new highs and breaking above $ 2,000.
But the climb ended under $ 2,080, where a quick reversal lower followed in the next few days. However the 20 SMA (green) held as support on the daily chart, and a doji candlestick formed down there – this is a bullish reversing signal after the pullback.
Gold has bounced from there, but it hasn’t been able to make new highs. In fact, the highs have been getting lower during this time, which is a sign that the pressure is shifting to the downside, despite the weakness of the USD. Today we are seeing another strong bearish move, as the USD gains some momentum, due to FED comments, which didn’t sound too dovish. Now the yellow metal is facing the 50 SMA (yellow) which stands at $ 1,920.
Sellers have pushed the price below this level for now, but we will see if they can keep it there. The support at $ 1,905 presents another obstacle for sellers, but if the 50 SMA goes, the decline is expected to stretch to the 100 SMA (green). If the price pulls back up above the 50 SMA, a bounce higher is likely to follow and we will probably go long on gold.
- Check out our free forex signals
- Follow the top economic events on FX Leaders economic calendar
- Trade better, discover more Forex Trading Strategies
- Open a FREE Trading Account
- Read our latest reviews on: Avatrade, Exness, HFM and XM
Related Articles


Sidebar rates
Related Posts
