The Daily Chart Points to More Bearish Momentum For NZD/USD, After Failing at Resistance
NZD/USD turned lower at 0.68 after forming a doji candlestick
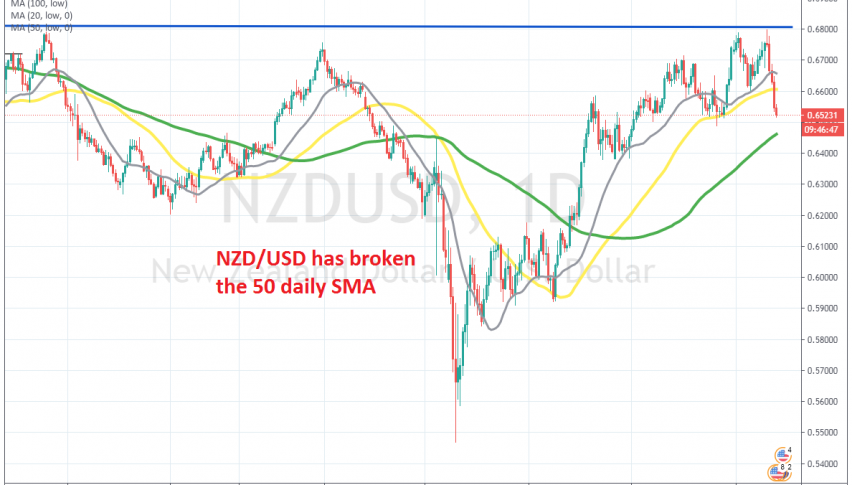
[[NZD/USD]] has been quite bullish for several months, since reversing higher in March. Moving averages were broken without much hassle and in total this pair gained more than 13 cents from the bottom. Moving averages turned into support after being broken.
The 20 SMA (grey) turned into support right away in May while the 50 SMA (yellow) came into play a little bit later,but those two moving average have been keeping the pressure to the upside for this pair. But, buyers failed to break above the previous high at 0.68.
That was the high from a year ago and it seems like that was the target for the buyers. The price formed an upside-down pin candlestick on Friday last week on the daily chart, which is a bearish reversing signal. The price reversed down and this pair turned quite bearish this week. Now this pair has lost more than 300 pips and the next target is the 100 SMA (green) standing 50 pips lower.
- Check out our free forex signals
- Follow the top economic events on FX Leaders economic calendar
- Trade better, discover more Forex Trading Strategies
- Open a FREE Trading Account
- Read our latest reviews on: Avatrade, Exness, HFM and XM
Related Articles


Sidebar rates
Related Posts
