Selling the Retrace in EUR/USD
EUR/USD is retreating higher today after it broke the support last week
[[EUR/USD]] climbed more than 12 cents since May, after this pair turned really bullish as the USD turned bearish. during that period. But, the climb ended on September 1, after the price broke above 1.20 in this pair. Since then, the pressure has shifted to the downside in EUR/USD.
Besides piercing 1.20 and reversing lower, another sign that the pressure shifted to downside are the lower highs. After reversing from 1.20, the next high was 1.1917, then 1.19 and finally below 1.19, before the definite bearish move started last Monday.
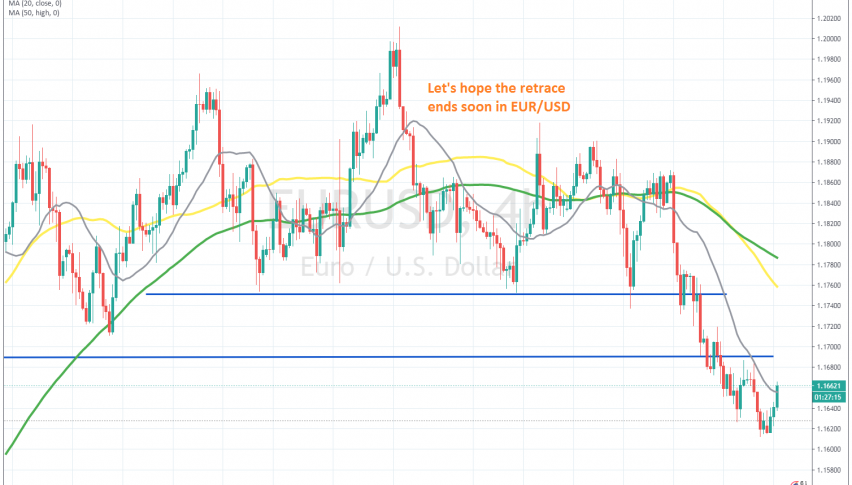
EUR/USD broke below the support at 1.1750 and 1.17 last week, which was another bearish sign. The 20 SMA (grey) turned into support last week, during a retrace higher on the H4 chart, pushing the price to 1.612. But we are seeing another pullback higher today, which we decided to sell.
The price has just moved above the 20 SMA where we decided to open a sell forex signal. If the price pulls back down and the H4 candlestick closes below the 20 SMA, then that would be a bearish sign, but let’s wait and see, because the retrace higher is complete on the H1 chart.
- Check out our free forex signals
- Follow the top economic events on FX Leaders economic calendar
- Trade better, discover more Forex Trading Strategies
- Open a FREE Trading Account
- Read our latest reviews on: Avatrade, Exness, HFM and XM
Related Articles


Sidebar rates
Related Posts
