Bitcoin Turning Higher at the 100 SMA Again
Bitcoin has bounced off the 100 SMA and is heading for the 50 daily SMA now
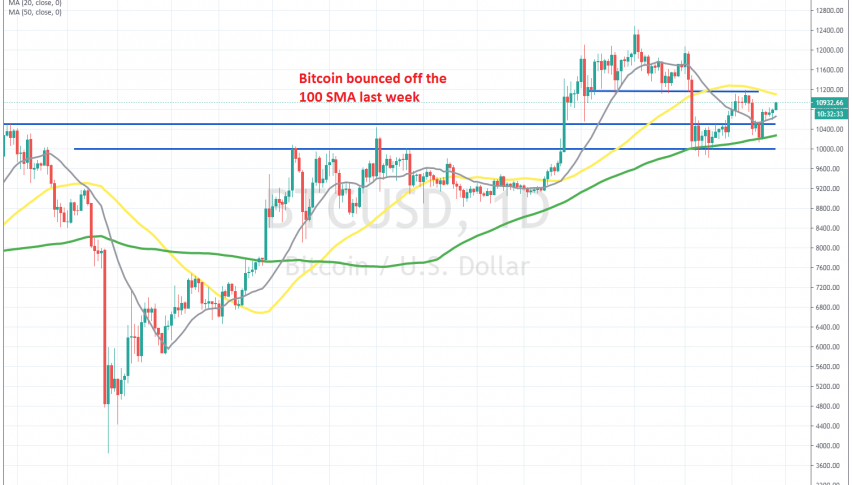
BITCOIN turned higher on March 13, reaching a price of $ 3,860, after the crash during the coronavirus panic. The price climbed close to $ 10,500 until June 1, before stalling and consolidating in a range which got narrower until the end of July, when the breakout came.
The breakout came to the upside, and the resistance was broken at $ 10,500. Then Bitcoin gained another $ 2,000, climbing pretty close to $ 12,500. But that level proved to be a stretch too far for Bitcoin buyers, and we saw a pullback, as a head and shoulders pattern formed up there, which worked out well.
Thereafter, the price fell below $ 10,000 in the first week of this month and it pierced the 100 SMA (green) on the daily chart several times. However, all the daily candlesticks closed above the 100 SMA, so that the moving average wasn’t broken. Then Bitcoin bounced higher, after failing to break the 100 SMA; however the 50 SMA and the neckline of the head and shoulders pattern then turned into resistance.
Bitcoin reversed lower, but the 100 SMA held as support again, this time above the $ 10,000 level. Bitcoin bounced off the 100 SMA once again, and it is now heading towards the 50 SMA for the second time. Now, we will see if the 50 SMA holds as resistance again. But, I would rather buy lower than sell higher, since the trend is still bullish.
- Check out our free forex signals
- Follow the top economic events on FX Leaders economic calendar
- Trade better, discover more Forex Trading Strategies
- Open a FREE Trading Account
- Read our latest reviews on: Avatrade, Exness, HFM and XM
Related Articles


Sidebar rates
Related Posts
