Gold Triangle – Sellers Dominate!
Earlier, I shared a forex trading signal to staying in sell below $1290. We lucked out and managed to close our trade in profit. Later, the
Earlier, I shared a forex trading signal to staying in sell below $1290. We lucked out and managed to close our trade in profit. Later, the market reversed to our entry price. Now, I'm looking at another hot trade setup in gold.
 Gold – 4-Hour Chart – Double Top
 Gold – 4-Hour Chart – Double Top
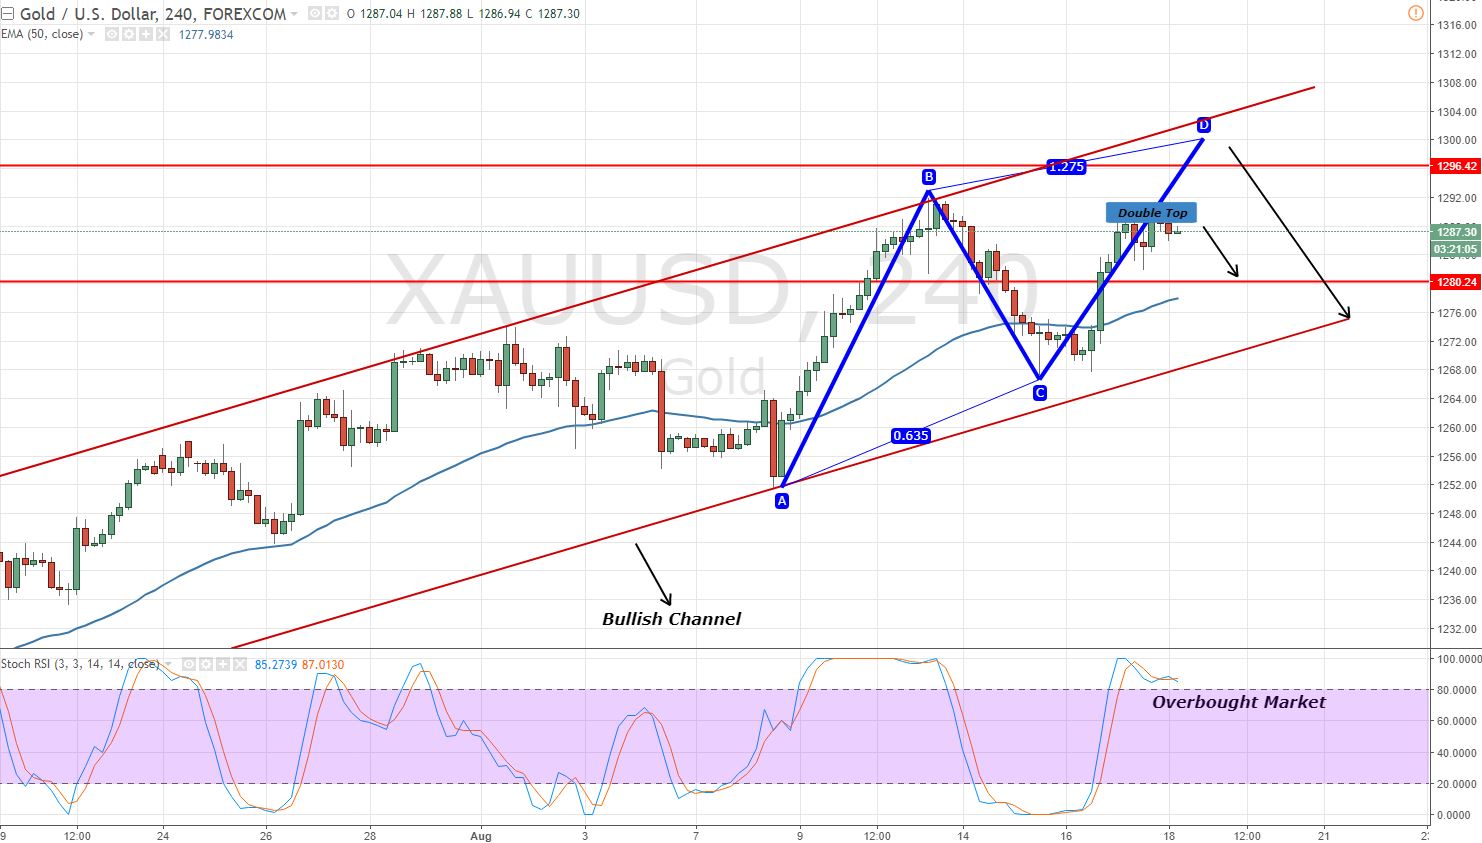
The ABCD pattern we discussed in our earlier updates is still in action. Today though, gold is offering something new the double top at $1290.
On the 4-hour timeframe, the yellow metal is consolidating below $1290 along with the Stochastic RSI at 85, the overbought region. This signifies the bulls will think twice before buying the overbought commodity.
Gold – XAU/USD – Trading Levels
Support Resistance
S1: 1282 R1: 1287
S2: 1277 R2: 1290
S3: 1274 R3: 1295
Gold Trading Plan
I'm looking to stay in sell only below $1290 with a stop loss above $1294 to target the $1284. In case the market breaks above $1290 and reaches $1299, that will be my second entry for taking a sell position. Good luck traders and have an awesome weekend!
- Check out our free forex signals
- Follow the top economic events on FX Leaders economic calendar
- Trade better, discover more Forex Trading Strategies
- Open a FREE Trading Account
- Read our latest reviews on: Avatrade, Exness, HFM and XM
Related Articles


Sidebar rates
Related Posts
