Crude Oil Breaks Below the 100 Daily SMA, After the 50 SMA Turned Into Resistance
Crude Oil has been declining and yesterday sellers pushed the price below the 100 daily SMA
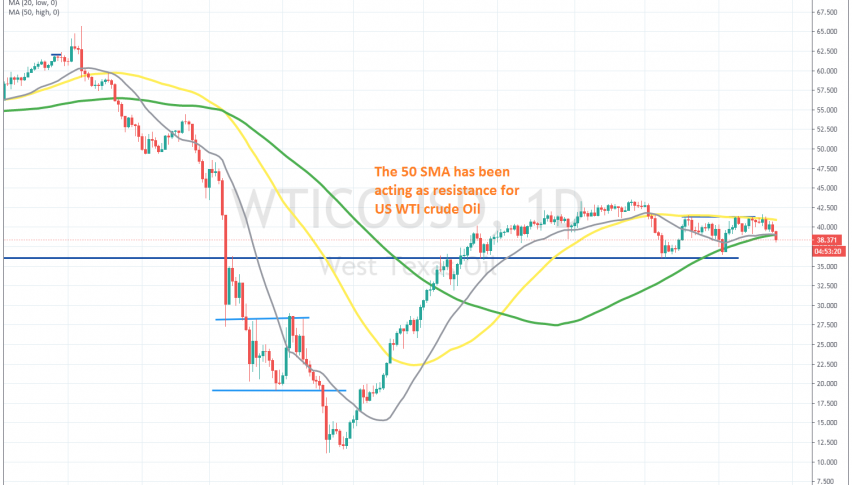
Crude Oil has had quite a roller-coaster ride this year. It was trading above $65 in early January, but it started declining as the the tensions between US and Iran increased and then the coronavirus came, first in China and then in the West, which sent US WTI crude to -$40, as Saudis started flooding markets with cheap Oil.
The 20 SMA (grey) was doing a great job as support during the bullish momentum, but the bullish momentum ended with the end of summer. The reversal came in the first week of September and US crude Oil broke below the moving averages which had been providing support on the daily chart.
Although, the price formed a support zone above $36. The price turned higher again, but the 50 SMA (yellow) turned into resistance, holding for more than a month. Last week, this moving average rejected the price once again and yesterday sellers pushed below the 100 SMA. Although, this is the second time the 100 SMA gets broken and the support above $36 still remains. Anyway, if the p[rice keeps declining we will look to go long at around $36.
- Check out our free forex signals
- Follow the top economic events on FX Leaders economic calendar
- Trade better, discover more Forex Trading Strategies
- Open a FREE Trading Account
- Read our latest reviews on: Avatrade, Exness, HFM and XM
Related Articles


Sidebar rates
Related Posts
