Prices Forecast: Technical Analysis
For Aave, the predicted daily closing price is $180.00, with a range of $175.00 to $185.00. Over the week, we anticipate a closing price of $185.00, with a range between $180.00 and $190.00. The technical indicators suggest a bullish sentiment, as the RSI is currently at 58.56, indicating upward momentum. The ATR of 8.95 suggests moderate volatility, which could lead to price fluctuations within the predicted range. The price has been trading above the pivot point of $177.45, reinforcing the bullish outlook. Resistance levels at $180.65 and $182.67 may act as barriers to further upward movement, while support levels at $175.44 and $172.24 provide a safety net. Overall, the combination of these indicators suggests that Aave is poised for a potential upward trend in the coming days.
Fundamental Overview and Analysis
Aave has shown a strong performance recently, with prices recovering from previous lows. Factors influencing its value include increased demand for decentralized finance (DeFi) solutions and positive investor sentiment towards cryptocurrencies. The asset’s scalability and ongoing technological advancements position it well for future growth. However, challenges such as regulatory scrutiny and competition from other DeFi platforms could impact its market position. Currently, Aave appears to be fairly valued based on its recent price movements and market conditions. Investors are optimistic, but caution is warranted due to potential market volatility and external economic factors.
Outlook for Aave
The future outlook for Aave remains positive, with market trends indicating a potential upward trajectory. Historical price movements show resilience, and current volatility suggests opportunities for traders. Key factors influencing Aave’s price include ongoing developments in the DeFi space and broader economic conditions. In the short term (1 to 6 months), we expect Aave to maintain its upward momentum, potentially reaching prices above $190. Long-term projections (1 to 5 years) suggest continued growth, driven by increasing adoption and innovation in the DeFi sector. However, external events such as regulatory changes or market downturns could pose risks to this outlook.
Technical Analysis
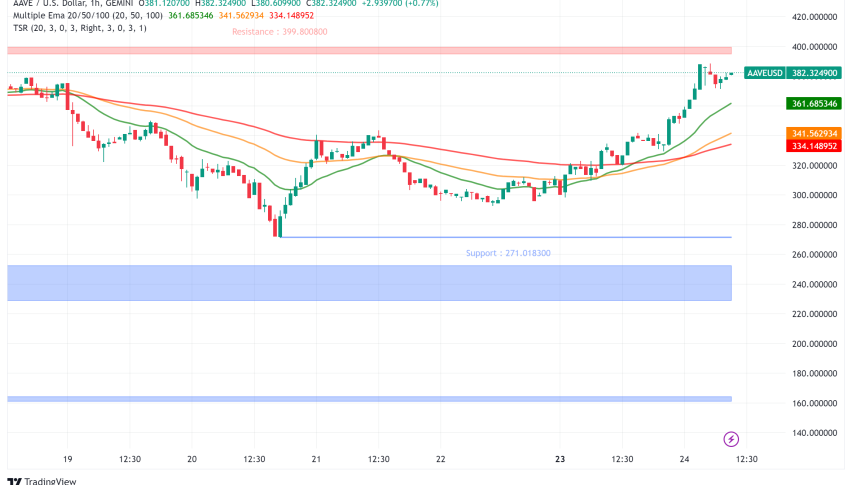
Current Price Overview: The current price of Aave is $178.64, slightly down from the previous close of $178.64. Over the last 24 hours, the price has shown slight volatility, with notable fluctuations around the $180 mark. Support and Resistance Levels: Key support levels are at $175.44, $172.24, and $170.23, while resistance levels are at $180.65, $182.67, and $185.86. The pivot point is $177.45, and Aave is currently trading above this level, indicating bullish sentiment. Technical Indicators Analysis: The RSI at 58.56 suggests a bullish trend, while the ATR of 8.95 indicates moderate volatility. The ADX is at 18.25, suggesting a weak trend strength. The 50-day SMA is at $180.00, and the 200-day EMA is at $175.00, indicating a potential bullish crossover. Market Sentiment & Outlook: Sentiment is currently bullish, as the price is above the pivot point, and the RSI indicates upward momentum.
Forecasting Returns: $1,000 Across Market Conditions
The table below outlines potential investment scenarios for Aave, providing insights into expected returns based on different market conditions.
| Scenario | Price Change | Value After 1 Month |
|---|---|---|
| Bullish Breakout | +10% to ~$196.00 | ~$1,100 |
| Sideways Range | 0% to ~$178.64 | ~$1,000 |
| Bearish Dip | -10% to ~$160.00 | ~$900 |
FAQs
What are the predicted price forecasts for the asset?
The predicted daily closing price for Aave is $180.00, with a weekly forecast of $185.00. The price is expected to range between $175.00 and $190.00 over the week.
What are the key support and resistance levels for the asset?
Key support levels for Aave are at $175.44, $172.24, and $170.23. Resistance levels are at $180.65, $182.67, and $185.86, with a pivot point at $177.45.
What are the main factors influencing the asset’s price?
Factors influencing Aave’s price include demand for DeFi solutions, investor sentiment, and regulatory developments. Market volatility and competition also play significant roles.
What is the outlook for the asset in the next 1 to 6 months?
The outlook for Aave in the next 1 to 6 months is positive, with expectations of upward momentum. Continued growth in the DeFi sector and technological advancements are key drivers.
Disclaimer
In conclusion, while the analysis provides a structured outlook on the asset’s potential price movements, it is essential to remember that financial markets are inherently unpredictable. Conducting thorough research and staying informed about market trends and economic indicators is crucial for making informed investment decisions.