Prices Forecast: Technical Analysis
For today, the predicted closing price for Cardano is approximately $0.4001, with a range between $0.3900 and $0.4100. Looking ahead to the week, the expected closing price is around $0.4200, with a potential range of $0.4000 to $0.4400. The technical indicators suggest a neutral trend, with the RSI at 50.36 indicating neither overbought nor oversold conditions. The ATR of 0.0142 suggests low volatility, which may lead to a more stable price movement in the short term. The lack of significant resistance levels above the current price could allow for upward movement if buying pressure increases. Conversely, if selling pressure mounts, the support levels could be tested. Overall, the market sentiment appears cautiously optimistic, with potential for growth if positive momentum builds.
Fundamental Overview and Analysis
Cardano has recently shown a mixed performance, with fluctuations in price reflecting broader market trends. Factors influencing its value include ongoing developments in its blockchain technology and investor sentiment towards cryptocurrencies. The recent regulatory environment has also played a role, as clarity in regulations can boost investor confidence. Market participants are generally optimistic about Cardano’s scalability and potential for future growth, especially with its focus on sustainability and smart contracts. However, challenges such as competition from other blockchain platforms and market volatility remain significant risks. Currently, Cardano appears to be fairly valued, but any major technological advancements or partnerships could enhance its market position.
Outlook for Cardano
The future outlook for Cardano remains positive, with expectations of gradual price appreciation driven by technological advancements and increased adoption. Current market trends indicate a potential for upward movement, especially if the broader cryptocurrency market rallies. In the short term (1 to 6 months), prices could range from $0.4000 to $0.5000, depending on market conditions and investor sentiment. Long-term forecasts (1 to 5 years) suggest that Cardano could see significant growth, potentially reaching $1.00 or more if it successfully scales and captures market share. External factors such as regulatory developments and macroeconomic conditions will play a crucial role in shaping its price trajectory. Overall, Cardano’s innovative approach positions it well for future success, but investors should remain aware of the inherent risks.
Technical Analysis
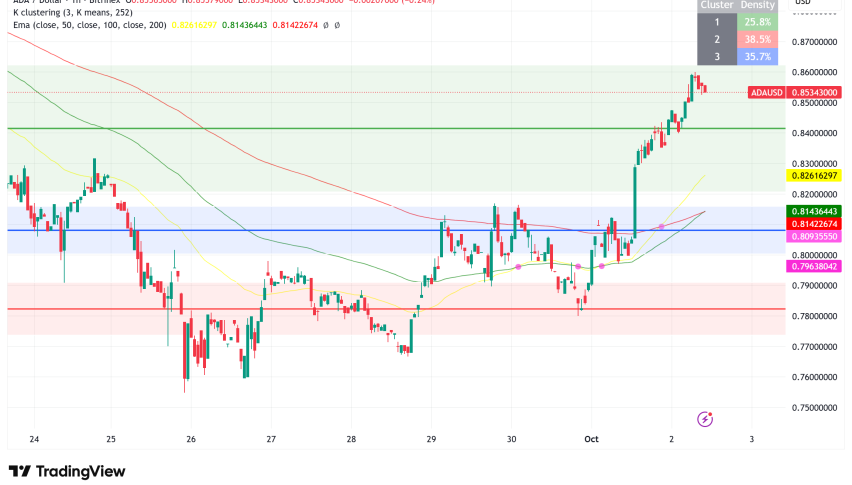
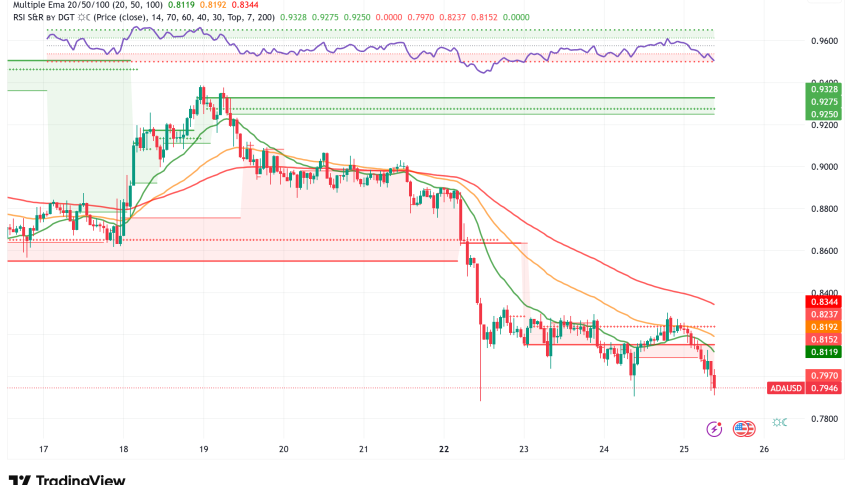
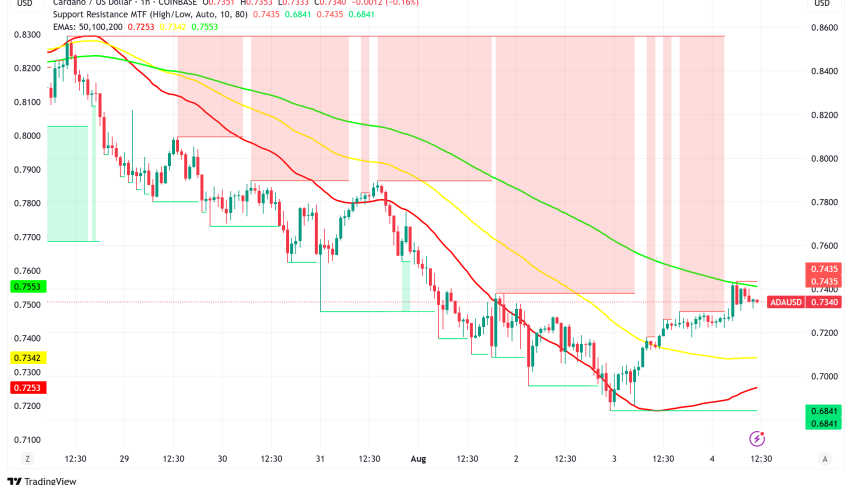
Current Price Overview: The current price of Cardano is $0.4001. This reflects a slight increase from the previous close, indicating a positive sentiment in the market. Over the last 24 hours, the price has shown moderate volatility, with no significant patterns emerging. Support and Resistance Levels: The identified support levels are $0.3900, $0.3800, and $0.3700, while resistance levels are at $0.4100, $0.4200, and $0.4300. The pivot point is currently not available, indicating uncertainty in the market direction. Technical Indicators Analysis: The RSI at 50.36 suggests a neutral trend, while the ATR of 0.0142 indicates low volatility. The ADX is not available, but the lack of significant movement suggests a weak trend. The 50-day SMA and 200-day EMA are not crossing, indicating no immediate trend change. Market Sentiment & Outlook: Sentiment appears neutral, with price action hovering around the pivot point. The RSI indicates a balanced market, while the ATR suggests limited volatility, leading to a cautious outlook.
Forecasting Returns: $1,000 Across Market Conditions
The following table outlines potential investment scenarios for Cardano, providing insights into expected returns based on different market conditions.
| Scenario | Price Change | Value After 1 Month |
|---|---|---|
| Bullish Breakout | +10% to ~$0.4401 | ~$1,100 |
| Sideways Range | 0% to ~$0.4001 | ~$1,000 |
| Bearish Dip | -10% to ~$0.3601 | ~$900 |
FAQs
What are the predicted price forecasts for the asset?
The predicted daily closing price for Cardano is approximately $0.4001, with a weekly forecast of around $0.4200. These predictions are based on current market trends and technical indicators.
What are the key support and resistance levels for the asset?
Key support levels for Cardano are at $0.3900, $0.3800, and $0.3700. Resistance levels are identified at $0.4100, $0.4200, and $0.4300, indicating potential price barriers.
What are the main factors influencing the asset’s price?
Factors influencing Cardano’s price include technological advancements, regulatory developments, and overall market sentiment towards cryptocurrencies. Investor confidence plays a significant role in price movements.
What is the outlook for the asset in the next 1 to 6 months?
The outlook for Cardano in the next 1 to 6 months is cautiously optimistic, with potential price movements ranging from $0.4000 to $0.5000. Market conditions and investor sentiment will heavily influence these projections.
What are the risks and challenges facing the asset?
Risks facing Cardano include competition from other blockchain platforms, market volatility, and regulatory hurdles. These factors could impact its growth and price stability.
Disclaimer
In conclusion, while the analysis provides a structured outlook on the asset’s potential price movements, it is essential to remember that financial markets are inherently unpredictable. Conducting thorough research and staying informed about market trends and economic indicators is crucial for making informed investment decisions.