Prices Forecast: Technical Analysis
For today, Cardano (ADA) is forecasted to close at approximately $0.1650, with a trading range expected between $0.1620 and $0.1680. Over the week, we anticipate a closing price around $0.1700, with a potential range of $0.1650 to $0.1750. The technical indicators suggest a bearish trend, as the RSI is currently at 30.9892, indicating oversold conditions. The ATR of 0.0109 suggests low volatility, which may limit significant price movements in the short term. The price is currently below the pivot point of $0.16, reinforcing the bearish sentiment. Resistance levels at $0.17 and $0.18 may act as barriers to upward movement. The market’s reaction to upcoming economic data, particularly retail sales figures, could influence price direction. Overall, the combination of technical indicators and market sentiment suggests a cautious approach for traders.
Fundamental Overview and Analysis
Cardano has recently experienced a downward trend, with prices declining significantly from previous highs. Factors influencing its value include ongoing developments in its blockchain technology and competition from other cryptocurrencies. Investor sentiment appears cautious, with many awaiting clearer signals of recovery. The upcoming retail sales data from the UK and Canada could impact market sentiment, as strong figures may boost confidence in risk assets like cryptocurrencies. However, challenges such as regulatory scrutiny and market volatility remain prevalent. Currently, Cardano appears undervalued compared to its historical performance, presenting potential buying opportunities for long-term investors. The scalability of its platform and upcoming upgrades could drive future growth, but investors should remain aware of the risks associated with market fluctuations.
Outlook for Cardano
The future outlook for Cardano remains mixed, with potential for recovery if market conditions improve. Current trends indicate a bearish sentiment, but any positive news regarding technological advancements or partnerships could shift the momentum. In the short term (1 to 6 months), prices may stabilize around the $0.1700 mark, with potential for gradual recovery if bullish sentiment returns. Long-term forecasts (1 to 5 years) suggest that if Cardano can successfully implement its roadmap, it could see significant price appreciation. However, external factors such as regulatory changes and market competition could pose risks to this outlook. Investors should monitor developments closely, as shifts in market dynamics could lead to rapid price changes.
Technical Analysis
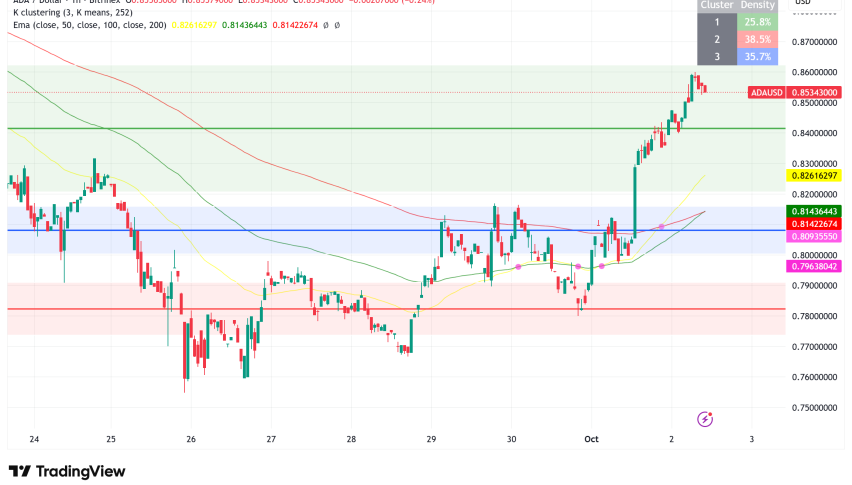
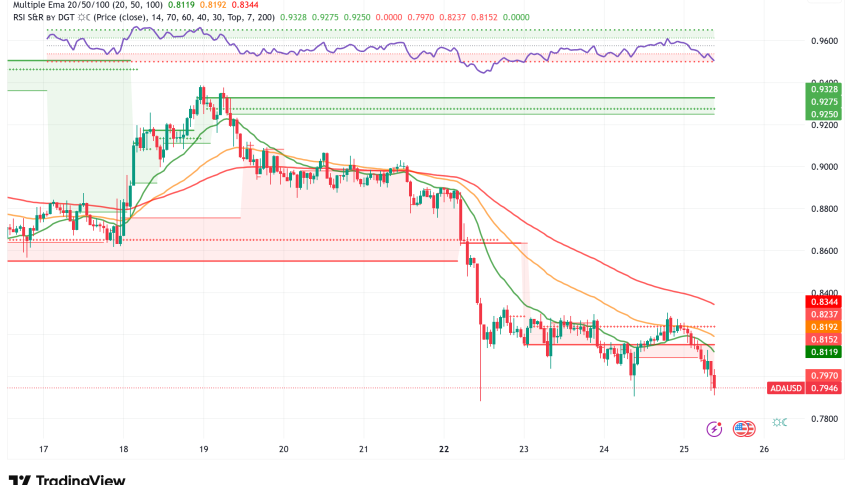
Current Price Overview: The current price of Cardano is $0.1628, which is slightly lower than the last closing price of $0.1628. Over the last 24 hours, the price has shown slight volatility, with a range between $0.1620 and $0.1650. Support and Resistance Levels: Key support levels are at $0.16, $0.15, and $0.14, while resistance levels are at $0.17, $0.18, and $0.19. The asset is currently trading below the pivot point of $0.16, indicating bearish sentiment. Technical Indicators Analysis: The RSI is at 30.9892, suggesting oversold conditions and a potential for a bullish reversal. The ATR of 0.0109 indicates low volatility, while the ADX at 39.9737 shows a strong trend. The 50-day SMA is at $0.1822, and the 200-day EMA is at $0.2402, indicating a bearish crossover. Market Sentiment & Outlook: Sentiment is currently bearish, as the price is below the pivot point, and the RSI indicates oversold conditions. The ADX suggests a strong trend, which could lead to further downward movement unless a reversal occurs.
Forecasting Returns: $1,000 Across Market Conditions
The table below outlines potential investment scenarios for Cardano, providing insights into expected price changes and estimated returns based on different market conditions.
| Scenario | Price Change | Value After 1 Month |
|---|---|---|
| Bullish Breakout | +10% to ~$0.179 | ~$1,100 |
| Sideways Range | 0% to ~$0.162 | ~$1,000 |
| Bearish Dip | -10% to ~$0.146 | ~$900 |
FAQs
What are the predicted price forecasts for the asset?
The predicted daily closing price for Cardano is approximately $0.1650, with a weekly forecast of around $0.1700. The expected trading range for today is between $0.1620 and $0.1680.
What are the key support and resistance levels for the asset?
Key support levels for Cardano are at $0.16, $0.15, and $0.14. Resistance levels are identified at $0.17, $0.18, and $0.19, with the current price trading below the pivot point of $0.16.
What are the main factors influencing the asset’s price?
Factors influencing Cardano’s price include technological advancements, competition from other cryptocurrencies, and market sentiment. Upcoming economic data, such as retail sales figures, may also impact investor confidence.
What is the outlook for the asset in the next 1 to 6 months?
In the short term, Cardano’s price may stabilize around $0.1700, with potential for gradual recovery if bullish sentiment returns. However, market volatility and regulatory challenges could pose risks to this outlook.
What are the risks and challenges facing the asset?
Cardano faces risks such as regulatory scrutiny, market volatility, and competition from other blockchain platforms. These factors could impact its price and overall market performance.
Disclaimer
In conclusion, while the analysis provides a structured outlook on the asset’s potential price movements, it is essential to remember that financial markets are inherently unpredictable. Conducting thorough research and staying informed about market trends and economic indicators is crucial for making informed investment decisions.