Prices Forecast: Technical Analysis
For today, we predict a closing price for Compound at approximately $17.80, with a range between $17.50 and $18.00. Looking ahead to the week, we anticipate a closing price around $18.20, with a potential range of $17.80 to $18.60. The technical indicators suggest a cautious bullish sentiment, as the RSI is currently at 44.11, indicating a neutral trend but close to oversold territory. The ATR of 1.0002 suggests moderate volatility, which could lead to price fluctuations within the predicted range. The pivot point at $17.86 indicates that the price is currently trading just below this level, which could act as a resistance point. If the price breaks above this pivot, it may signal further upward momentum. Conversely, if it fails to hold above the support levels, we could see a decline towards the lower range. Overall, the combination of these indicators suggests a potential for slight upward movement in the short term.
Fundamental Overview and Analysis
Compound has recently experienced fluctuations in its price, reflecting broader market trends and investor sentiment. Factors influencing its value include the ongoing developments in the DeFi space, regulatory scrutiny, and the overall performance of cryptocurrencies. Recent economic data, such as retail sales figures in the U.S., may also impact investor confidence and spending behavior. Market participants are currently optimistic about Compound’s scalability and potential for growth, especially as DeFi continues to gain traction. However, risks remain, including competition from other DeFi platforms and potential regulatory challenges that could affect operations. Currently, Compound appears to be fairly valued based on its recent performance and market conditions, but investors should remain vigilant about market volatility.
Outlook for Compound
The future outlook for Compound appears cautiously optimistic, with potential for growth driven by increasing adoption of DeFi solutions. Current market trends indicate a gradual recovery, with historical price movements suggesting a potential upward trajectory. Key factors likely to influence the price include macroeconomic conditions, regulatory developments, and technological advancements within the blockchain space. In the short term (1 to 6 months), we expect Compound to trade within a range of $17.50 to $20.00, depending on market sentiment and external economic factors. Over the long term (1 to 5 years), if the DeFi sector continues to expand, Compound could see significant price appreciation, potentially reaching levels above $25. However, investors should be aware of external risks such as market corrections and regulatory changes that could impact price stability.
Technical Analysis
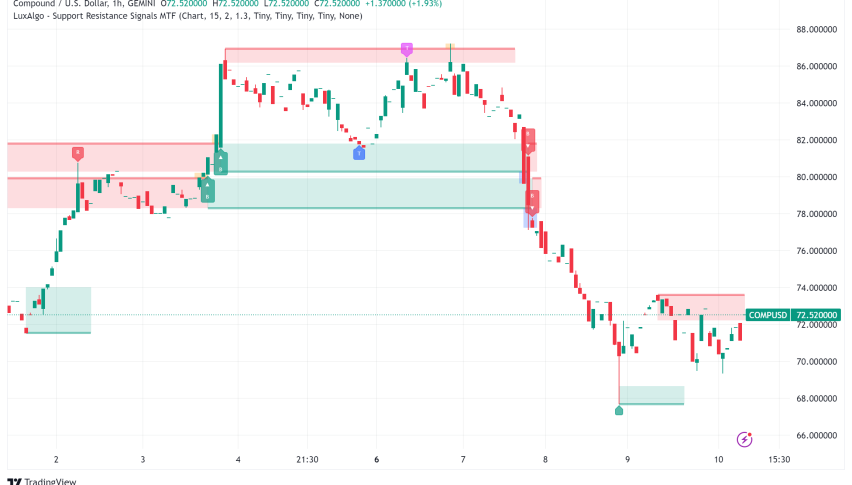
Current Price Overview: The current price of Compound is $17.66, which is slightly lower than the previous close of $17.80. Over the last 24 hours, the price has shown a slight downward trend with moderate volatility, indicating a cautious market sentiment. Support and Resistance Levels: The identified support levels are $17.55, $17.69, and $17.72, while resistance levels are $17.83, $18.00, and $17.97. The pivot point is at $17.86, and since the price is currently below this level, it suggests a bearish sentiment. Technical Indicators Analysis: The RSI at 44.11 indicates a neutral trend, suggesting neither overbought nor oversold conditions. The ATR of 1.0002 reflects moderate volatility, while the ADX at 16.84 suggests a weak trend. The 50-day SMA is at $20.3854, and the 200-day EMA is at $19.3363, indicating no crossover at this time. Market Sentiment & Outlook: Overall, the sentiment appears bearish as the price is trading below the pivot point, and the RSI indicates a lack of strong momentum.
Forecasting Returns: $1,000 Across Market Conditions
The table below outlines potential investment scenarios for Compound, providing insights into expected price changes and estimated returns based on different market conditions.
| Scenario | Price Change | Value After 1 Month |
|---|---|---|
| Bullish Breakout | +10% to ~$19.43 | ~$1,100 |
| Sideways Range | 0% to ~$17.66 | ~$1,000 |
| Bearish Dip | -10% to ~$15.89 | ~$900 |
FAQs
What are the predicted price forecasts for the asset?
The predicted daily closing price for Compound is approximately $17.80, with a range between $17.50 and $18.00. For the weekly forecast, we anticipate a closing price around $18.20, with a potential range of $17.80 to $18.60.
What are the key support and resistance levels for the asset?
The key support levels for Compound are $17.55, $17.69, and $17.72. The resistance levels are $17.83, $18.00, and $17.97, with a pivot point at $17.86 indicating a critical level for price movement.
What are the main factors influencing the asset’s price?
The main factors influencing Compound’s price include developments in the DeFi sector, regulatory scrutiny, and overall market sentiment. Economic indicators, such as retail sales data, also play a significant role in shaping investor confidence.
What is the outlook for the asset in the next 1 to 6 months?
In the next 1 to 6 months, Compound is expected to trade within a range of $17.50 to $20.00, depending on market sentiment and external economic factors. The outlook remains cautiously optimistic as the DeFi sector continues to grow.
What are the risks and challenges facing the asset?
The risks facing Compound include competition from other DeFi platforms, market volatility, and potential regulatory challenges. Investors should remain vigilant about these factors as they could significantly impact price stability.
Disclaimer
In conclusion, while the analysis provides a structured outlook on the asset’s potential price movements, it is essential to remember that financial markets are inherently unpredictable. Conducting thorough research and staying informed about market trends and economic indicators is crucial for making informed investment decisions.