Prices Forecast: Technical Analysis
For today, we predict a closing price for Cosmos at approximately $1.85, with a range between $1.82 and $1.88. Looking ahead to the week, we anticipate a closing price around $1.91, with a potential range of $1.88 to $1.94. The technical indicators suggest a cautious outlook; the RSI is currently at 38.85, indicating a bearish trend, while the ATR of 0.1181 suggests moderate volatility. The price has been trading below the pivot point of $1.85, which typically signals a bearish sentiment. However, if the price can break above the resistance levels, we might see a shift in momentum. The recent price action shows a struggle to maintain upward movement, with the last close at $1.8387 reflecting this challenge. Overall, the indicators suggest that while there may be short-term fluctuations, the broader trend remains bearish unless significant buying pressure emerges.
Fundamental Overview and Analysis
Cosmos has experienced a notable decline in recent months, with prices dropping from previous highs. This downturn can be attributed to a combination of market volatility and investor sentiment shifting towards more stable assets. Factors such as regulatory scrutiny and competition from other blockchain technologies have also played a role in influencing Cosmos’s value. Despite these challenges, there are opportunities for growth, particularly as the ecosystem expands and more projects adopt its technology. Investor sentiment appears mixed, with some viewing the current price as an opportunity to buy at a lower valuation. However, risks remain, including potential market corrections and the need for continuous innovation to stay competitive. Currently, Cosmos seems to be undervalued based on its technological potential and market position.
Outlook for Cosmos
The future outlook for Cosmos appears cautiously optimistic, with potential for recovery if market conditions improve. Current trends indicate a bearish sentiment, but historical price movements suggest that a reversal could occur if buying interest increases. In the short term (1 to 6 months), we could see prices range from $1.80 to $2.00, depending on market sentiment and external factors. Long-term projections (1 to 5 years) suggest that if Cosmos can capitalize on its technological advantages, prices could rise significantly, potentially reaching $3.00 or higher. However, external factors such as regulatory changes and market dynamics will play a crucial role in this trajectory. Investors should remain vigilant about market developments that could impact prices, including technological advancements and competitive pressures.
Technical Analysis
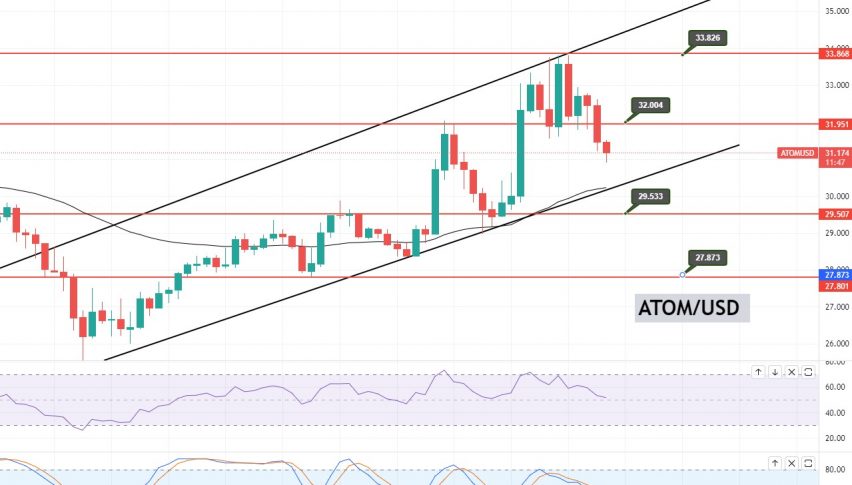
Current Price Overview: The current price of Cosmos is $1.8387, slightly down from the previous close of $1.8387. Over the last 24 hours, the price has shown slight volatility, indicating a bearish trend with no significant upward movement. Support and Resistance Levels: Key support levels are at $1.82, $1.79, and $1.75, while resistance levels are at $1.88, $1.91, and $1.94. The pivot point is $1.85, and since the price is currently below this level, it suggests a bearish outlook. Technical Indicators Analysis: The RSI is at 38.85, indicating a bearish trend. The ATR of 0.1181 suggests moderate volatility, while the ADX at 24.9777 indicates a weak trend. The 50-day SMA and 200-day EMA are not currently crossing, suggesting no immediate trend reversal. Market Sentiment & Outlook: Sentiment is currently bearish, as indicated by the price action below the pivot point and the RSI’s downward direction.
Forecasting Returns: $1,000 Across Market Conditions
The table below outlines potential investment scenarios for Cosmos, providing insights into expected returns based on different market conditions.
| Scenario | Price Change | Value After 1 Month |
|---|---|---|
| Bullish Breakout | +10% to ~$2.023 | ~$1,100 |
| Sideways Range | 0% to ~$1.838 | ~$1,000 |
| Bearish Dip | -10% to ~$1.655 | ~$900 |
FAQs
What are the predicted price forecasts for the asset?
The predicted daily closing price for Cosmos is approximately $1.85, with a weekly forecast of around $1.91. These predictions are based on current technical indicators and market sentiment.
What are the key support and resistance levels for the asset?
Key support levels for Cosmos are at $1.82, $1.79, and $1.75, while resistance levels are at $1.88, $1.91, and $1.94. The pivot point is $1.85, indicating a critical level for price movement.
What are the main factors influencing the asset’s price?
Factors influencing Cosmos’s price include market volatility, investor sentiment, regulatory scrutiny, and competition from other blockchain technologies. These elements can significantly impact demand and supply dynamics.
What is the outlook for the asset in the next 1 to 6 months?
In the next 1 to 6 months, Cosmos could see prices ranging from $1.80 to $2.00, depending on market sentiment and external factors. A recovery is possible if buying interest increases.
What are the risks and challenges facing the asset?
Risks facing Cosmos include potential market corrections, regulatory challenges, and the need for continuous innovation to remain competitive. These factors could hinder its growth potential.
Disclaimer
In conclusion, while the analysis provides a structured outlook on the asset’s potential price movements, it is essential to remember that financial markets are inherently unpredictable. Conducting thorough research and staying informed about market trends and economic indicators is crucial for making informed investment decisions.