Prices Forecast: Technical Analysis
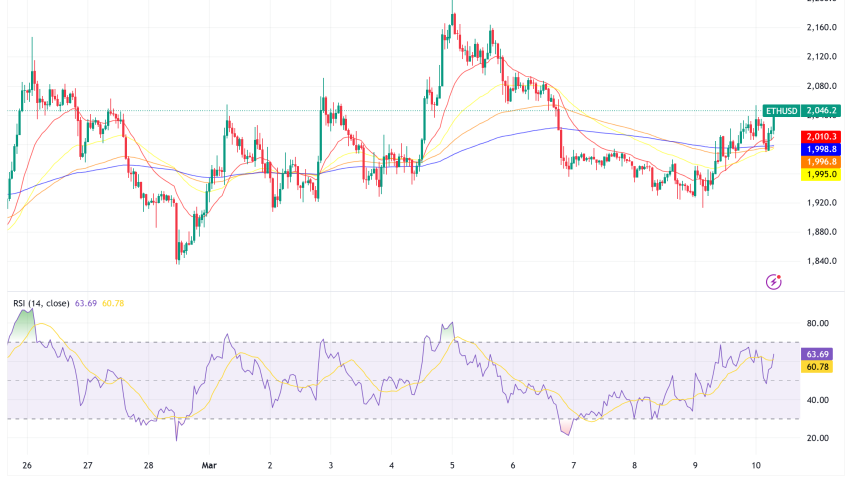
For today, the predicted closing price for Ethereum is $1995.00, with a range of $1980.00 to $2010.00. Looking ahead to the week, the expected closing price is $2020.00, with a range of $1980.00 to $2050.00. The technical indicators suggest a cautious bullish sentiment, as the RSI is currently at 46.0423, indicating a neutral trend but leaning towards bullish if it crosses above 50. The ATR of 127.3855 indicates moderate volatility, suggesting that price movements could be significant within the predicted range. The pivot point at $1991.81 shows that Ethereum is trading slightly above this level, which is a positive sign for potential upward movement. Resistance levels at $2048.76 and $2104.54 could act as barriers if the price attempts to rally. Conversely, support levels at $1936.04 and $1879.09 provide a safety net for any downward corrections. Overall, the combination of these indicators suggests a potential for upward movement in the short term, but traders should remain vigilant for any signs of reversal.
Fundamental Overview and Analysis
Ethereum has recently experienced fluctuations, with the price hovering around $1992.9861. Factors influencing its value include ongoing developments in the Ethereum network, such as upgrades and scalability solutions, which are crucial for its long-term growth. Investor sentiment appears cautiously optimistic, as many are looking forward to the upcoming Ethereum upgrades that promise to enhance its performance and usability. However, the market remains sensitive to regulatory news and competition from other blockchain platforms, which could impact Ethereum’s market share. The current valuation suggests that Ethereum is fairly priced, considering its potential for future growth and the risks associated with market volatility. Additionally, the demand for decentralized applications (dApps) and smart contracts continues to drive interest in Ethereum, positioning it well for future expansion. Nevertheless, challenges such as network congestion and high transaction fees could hinder its adoption if not addressed.
Outlook for Ethereum
The future outlook for Ethereum remains cautiously optimistic, with market trends indicating potential growth in the coming months. Historical price movements show a pattern of recovery after dips, suggesting resilience in the face of market volatility. Key factors likely to influence Ethereum’s price include technological advancements, particularly the transition to Ethereum 2.0, which aims to improve scalability and reduce energy consumption. In the short term (1 to 6 months), Ethereum could see price movements ranging from $1800 to $2200, depending on market sentiment and external economic conditions. Long-term forecasts (1 to 5 years) suggest that Ethereum could potentially reach new highs if it successfully implements its upgrades and maintains its position as a leading smart contract platform. However, external factors such as regulatory changes and competition from other cryptocurrencies could pose risks to this growth trajectory. Overall, Ethereum’s adaptability and ongoing development efforts position it favorably for future success.
Technical Analysis
Current Price Overview: The current price of Ethereum is $1992.9861, which is slightly above the previous close of $1992.1943. Over the last 24 hours, the price has shown slight upward movement, indicating a potential bullish sentiment. Support and Resistance Levels: Key support levels are at $1936.04, $1879.09, and $1823.31, while resistance levels are at $2048.76, $2104.54, and $2161.49. The pivot point is $1991.81, and since Ethereum is trading above this level, it suggests a bullish outlook. Technical Indicators Analysis: The RSI is at 46.0423, indicating a neutral trend but leaning towards bullish if it crosses above 50. The ATR of 127.3855 suggests moderate volatility, while the ADX at 27.8734 indicates a strengthening trend. The 50-day SMA and 200-day EMA are not currently crossing, indicating no immediate trend reversal. Market Sentiment & Outlook: Sentiment appears cautiously bullish, as the price is above the pivot point, and the RSI is showing potential for upward movement.
Forecasting Returns: $1,000 Across Market Conditions
The table below outlines potential market scenarios for Ethereum and the expected returns on a $1,000 investment. Each scenario reflects different market conditions and their impact on Ethereum’s price.
| Scenario | Price Change | Value After 1 Month |
|---|---|---|
| Bullish Breakout | +10% to ~$2,191 | ~$1,100 |
| Sideways Range | 0% to ~$1,992 | ~$1,000 |
| Bearish Dip | -10% to ~$1,793 | ~$900 |
FAQs
What are the predicted price forecasts for the asset?
The predicted daily closing price for Ethereum is $1995.00, with a range of $1980.00 to $2010.00. For the weekly forecast, the expected closing price is $2020.00, with a range of $1980.00 to $2050.00.
What are the key support and resistance levels for the asset?
Key support levels for Ethereum are at $1936.04, $1879.09, and $1823.31. Resistance levels are at $2048.76, $2104.54, and $2161.49, with the pivot point at $1991.81.
What are the main factors influencing the asset’s price?
Factors influencing Ethereum’s price include ongoing network upgrades, investor sentiment, and regulatory developments. The demand for decentralized applications and smart contracts also plays a significant role.
What is the outlook for the asset in the next 1 to 6 months?
In the short term, Ethereum could see price movements ranging from $1800 to $2200, depending on market sentiment and external economic conditions. The outlook remains cautiously optimistic as technological advancements continue.
What are the risks and challenges facing the asset?
Risks facing Ethereum include regulatory changes, competition from other cryptocurrencies, and market volatility. Addressing network congestion and high transaction fees is crucial for its long-term success.
Disclaimer
In conclusion, while the analysis provides a structured outlook on the asset’s potential price movements, it is essential to remember that financial markets are inherently unpredictable. Conducting thorough research and staying informed about market trends and economic indicators is crucial for making informed investment decisions.