Prices Forecast: Technical Analysis
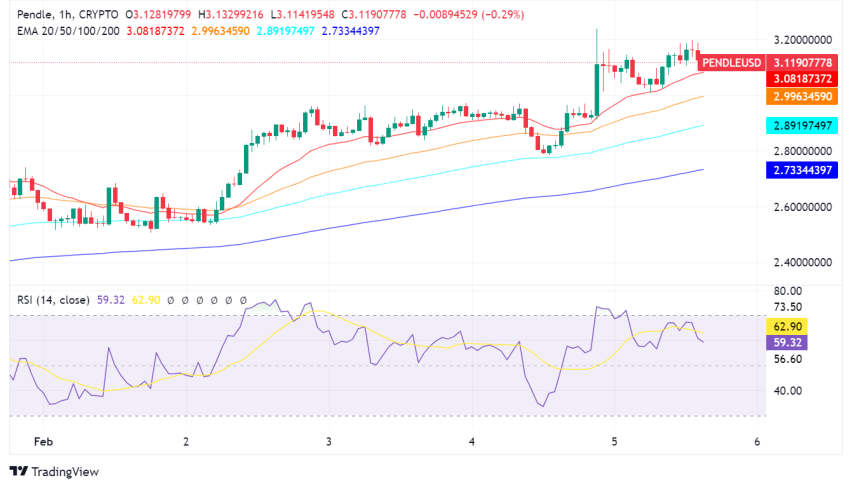
For today, we predict Pendle’s closing price to be around **$1.12**, with a range between **$1.08** and **$1.14**. Looking ahead to the week, we anticipate a closing price of approximately **$1.15**, with a potential range of **$1.10** to **$1.20**. The technical indicators suggest a bearish sentiment, as the RSI is currently at **37.7253**, indicating that the asset is oversold. The ATR of **0.0698** suggests moderate volatility, which could lead to price fluctuations within the predicted range. The pivot point is at **$1.11**, and since the current price is slightly above this level, it may act as a support. Resistance levels at **$1.14** and **$1.16** could limit upward movement. Overall, the bearish trend indicated by the RSI and the recent price action suggests that traders should be cautious and consider potential selling opportunities if the price approaches resistance levels.
Fundamental Overview and Analysis
Pendle has recently experienced a downward trend, with prices fluctuating significantly due to market volatility. Factors influencing its value include the overall demand for decentralized finance (DeFi) assets and the performance of the broader cryptocurrency market. Investor sentiment appears cautious, with many participants awaiting clearer signals before committing to new positions. The asset’s scalability and potential for integration with other DeFi protocols present opportunities for future growth. However, challenges such as regulatory scrutiny and competition from other DeFi projects could hinder its progress. Currently, Pendle seems to be undervalued based on its recent price movements, suggesting a potential buying opportunity for long-term investors. The market’s reaction to upcoming developments in the DeFi space will be crucial in determining Pendle’s future trajectory.
Outlook for Pendle
The outlook for Pendle remains cautiously optimistic, with potential for recovery if market conditions improve. Current trends indicate a bearish sentiment, but a shift in investor confidence could lead to upward price movements. In the short term (1 to 6 months), we expect Pendle to stabilize around **$1.20**, assuming no major negative developments occur. Long-term projections (1 to 5 years) suggest that if Pendle can capitalize on its unique offerings in the DeFi space, it could reach prices of **$2.00** or higher. Key factors influencing this outlook include regulatory developments, technological advancements, and overall market sentiment. External events, such as significant market corrections or innovations in the DeFi sector, could also impact Pendle’s price significantly. Investors should remain vigilant and adapt their strategies based on evolving market conditions.
Technical Analysis
Current Price Overview: The current price of Pendle is **$1.108**, which is slightly above the previous close of **$1.108**. Over the last 24 hours, the price has shown slight volatility, with minor fluctuations around the pivot point. Support and Resistance Levels: The identified support levels are **$1.08**, **$1.06**, and **$1.03**, while resistance levels are at **$1.14**, **$1.16**, and **$1.19**. The pivot point is **$1.11**, indicating that Pendle is trading just above this level, suggesting a potential for upward movement if it can break through resistance. Technical Indicators Analysis: The RSI is at **37.7253**, indicating a bearish trend. The ATR of **0.0698** suggests moderate volatility, while the ADX is at **15.2267**, indicating a weak trend. The 50-day SMA and 200-day EMA are not currently crossing, suggesting a lack of strong directional momentum. Market Sentiment & Outlook: Sentiment appears bearish, as indicated by the price action relative to the pivot, the downward trend in the RSI, and the lack of a moving average crossover.
Forecasting Returns: $1,000 Across Market Conditions
The table below outlines potential investment scenarios for Pendle, providing insights into expected returns based on different market conditions. Investors should consider these scenarios when deciding whether to invest $1,000 in Pendle.
| Scenario | Price Change | Value After 1 Month |
|---|---|---|
| Bullish Breakout | +10% to ~$1.22 | ~$1,100 |
| Sideways Range | 0% to ~$1.108 | ~$1,000 |
| Bearish Dip | -10% to ~$0.997 | ~$900 |
FAQs
What are the predicted price forecasts for the asset?
The predicted daily closing price for Pendle is approximately **$1.12**, with a range of **$1.08** to **$1.14**. For the weekly forecast, we anticipate a closing price of around **$1.15**, ranging from **$1.10** to **$1.20**.
What are the key support and resistance levels for the asset?
The key support levels for Pendle are **$1.08**, **$1.06**, and **$1.03**. The resistance levels are at **$1.14**, **$1.16**, and **$1.19**, with a pivot point at **$1.11**.
What are the main factors influencing the asset’s price?
Factors influencing Pendle’s price include market demand for DeFi assets, investor sentiment, and regulatory developments. Additionally, competition from other DeFi projects can impact its value.
What is the outlook for the asset in the next 1 to 6 months?
In the next 1 to 6 months, Pendle is expected to stabilize around **$1.20** if market conditions remain favorable. However, any significant negative developments could alter this outlook.
What are the risks and challenges facing the asset?
Pendle faces risks such as regulatory scrutiny, market volatility, and competition from other DeFi projects. These factors could hinder its growth and affect investor sentiment.
Disclaimer
In conclusion, while the analysis provides a structured outlook on the asset’s potential price movements, it is essential to remember that financial markets are inherently unpredictable. Conducting thorough research and staying informed about market trends and economic indicators is crucial for making informed investment decisions.