Prices Forecast: Technical Analysis
For today, we predict Solana’s closing price to be around $73.50, with a range between $72.00 and $75.00. Looking ahead to the week, we anticipate a closing price of approximately $75.00, with a potential range of $73.00 to $77.00. The technical indicators suggest a neutral trend, with the RSI at 49.0005 indicating neither overbought nor oversold conditions. The ATR of 3.5706 suggests moderate volatility, which could lead to price fluctuations within the predicted ranges. The pivot point at $73.27 indicates that Solana is currently trading just below this level, which may act as a resistance point. If the price breaks above this pivot, it could signal a bullish trend. Conversely, if it falls below the support levels of $72.06, it may indicate a bearish sentiment. Overall, the market sentiment appears cautious, and traders should watch for any significant movements around these key levels.
Fundamental Overview and Analysis
Solana has recently experienced a decline in price, reflecting broader market trends and investor sentiment. Factors influencing its value include ongoing developments in the blockchain space, competition from other cryptocurrencies, and regulatory scrutiny. The recent economic data, particularly inflation rates, may also impact investor confidence in crypto assets. Market participants are currently cautious, with many waiting for clearer signals before making significant investments. Opportunities for growth exist, particularly as Solana continues to enhance its scalability and transaction speeds. However, risks remain, including potential regulatory challenges and market volatility. Currently, Solana appears to be fairly priced, but investors should remain vigilant about market dynamics that could affect its valuation.
Outlook for Solana
The future outlook for Solana remains cautiously optimistic, with potential for growth driven by technological advancements and increased adoption. Current market trends indicate a consolidation phase, with prices stabilizing around the $73 mark. In the short term (1 to 6 months), we expect Solana to test the $75 resistance level, with potential for upward movement if market conditions improve. Long-term forecasts (1 to 5 years) suggest that Solana could benefit from increased institutional interest and broader acceptance of blockchain technology. However, external factors such as regulatory changes and market sentiment will play a crucial role in determining its price trajectory. Investors should keep an eye on developments within the crypto space, as these could significantly impact Solana’s future performance.
Technical Analysis
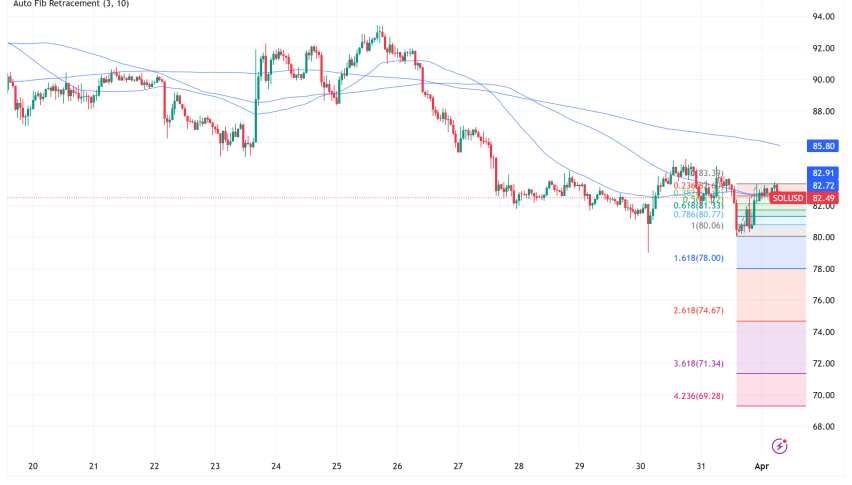
Current Price Overview: The current price of Solana is $72.76, which is slightly lower than the last closing price of $72.76. Over the last 24 hours, the price has shown slight volatility, with minor fluctuations around the $73 mark. Support and Resistance Levels: Key support levels are at $72.06, $71.36, and $70.15, while resistance levels are at $73.97, $75.18, and $75.88. The pivot point is at $73.27, indicating that Solana is currently trading just below this level, suggesting potential resistance. Technical Indicators Analysis: The RSI at 49.0005 indicates a neutral trend, suggesting neither bullish nor bearish momentum. The ATR of 3.5706 indicates moderate volatility, while the ADX at 29.5687 suggests a strengthening trend. The 50-day SMA is at $85.6001, and the 200-day EMA is at $85.9003, indicating no immediate crossover but a potential convergence. Market Sentiment & Outlook: Sentiment appears neutral, with price action hovering around the pivot point. The RSI and ADX suggest a lack of strong momentum, while the ATR indicates potential for volatility.
Forecasting Returns: $1,000 Across Market Conditions
The table below outlines potential investment scenarios for Solana, providing insights into expected price changes and estimated values for a $1,000 investment under different market conditions.
| Scenario | Price Change | Value After 1 Month |
|---|---|---|
| Bullish Breakout | +10% to ~$80.00 | ~$1,100 |
| Sideways Range | 0% to ~$72.76 | ~$1,000 |
| Bearish Dip | -10% to ~$65.00 | ~$900 |
FAQs
What are the predicted price forecasts for the asset?
The predicted daily closing price for Solana is approximately $73.50, with a range between $72.00 and $75.00. For the weekly forecast, we anticipate a closing price of around $75.00, with a potential range of $73.00 to $77.00.
What are the key support and resistance levels for the asset?
Key support levels for Solana are at $72.06, $71.36, and $70.15. Resistance levels are at $73.97, $75.18, and $75.88, with a pivot point at $73.27.
What are the main factors influencing the asset’s price?
Factors influencing Solana’s price include market sentiment, technological advancements, and regulatory developments. Additionally, broader economic conditions, such as inflation rates, can impact investor confidence in cryptocurrencies.
What is the outlook for the asset in the next 1 to 6 months?
In the next 1 to 6 months, Solana is expected to test the $75 resistance level, with potential for upward movement if market conditions improve. The outlook remains cautiously optimistic, driven by technological advancements and increased adoption.
What are the risks and challenges facing the asset?
Risks facing Solana include regulatory challenges, market volatility, and competition from other cryptocurrencies. Investors should remain vigilant about market dynamics that could affect its valuation.
Disclaimer
In conclusion, while the analysis provides a structured outlook on the asset’s potential price movements, it is essential to remember that financial markets are inherently unpredictable. Conducting thorough research and staying informed about market trends and economic indicators is crucial for making informed investment decisions.