Prices Forecast: Technical Analysis
For today, XRP is predicted to close at **$1.1451**, with a range between **$1.12** (low) and **$1.18** (high). Over the week, we anticipate a closing price of **$1.15**, with a range of **$1.12** to **$1.21**. The current RSI at **40.29** indicates a bearish trend, suggesting that XRP may struggle to gain momentum in the short term. The ATR of **0.0543** indicates low volatility, which could lead to a sideways movement in price. The pivot point at **$1.16** suggests that XRP is currently trading just below this level, which may act as a resistance. If XRP can break above **$1.18**, it could signal a potential bullish reversal. However, the bearish sentiment reflected in the RSI and the recent price action suggests caution for traders. Overall, the technical indicators point towards a cautious approach, with potential for slight upward movement if resistance levels are breached.
Fundamental Overview and Analysis
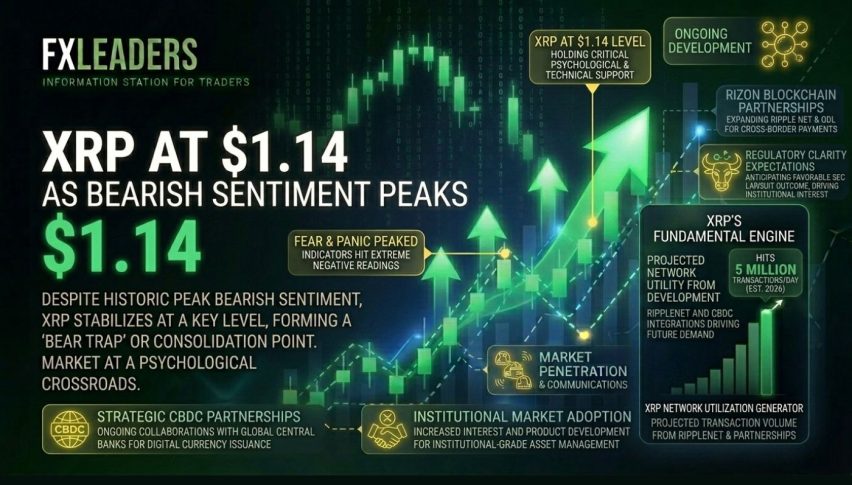
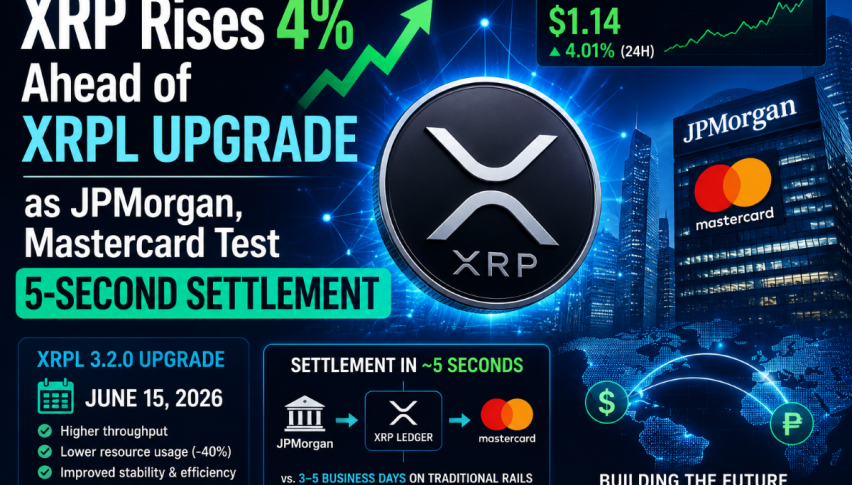
XRP has recently experienced a decline from its previous highs, with the latest close at **$1.1451**. Factors influencing its value include ongoing regulatory scrutiny and market sentiment surrounding cryptocurrencies. Investor sentiment appears cautious, with many awaiting clearer regulatory guidance before committing to significant investments. The recent economic data from the UK, particularly retail sales figures, may also impact market sentiment and indirectly affect XRP’s price. Opportunities for growth exist, particularly if XRP can expand its use cases in cross-border payments. However, risks remain, including competition from other cryptocurrencies and potential regulatory hurdles that could impact its adoption. Currently, XRP appears to be fairly priced, but volatility in the market could lead to fluctuations in its valuation.
Outlook for XRP
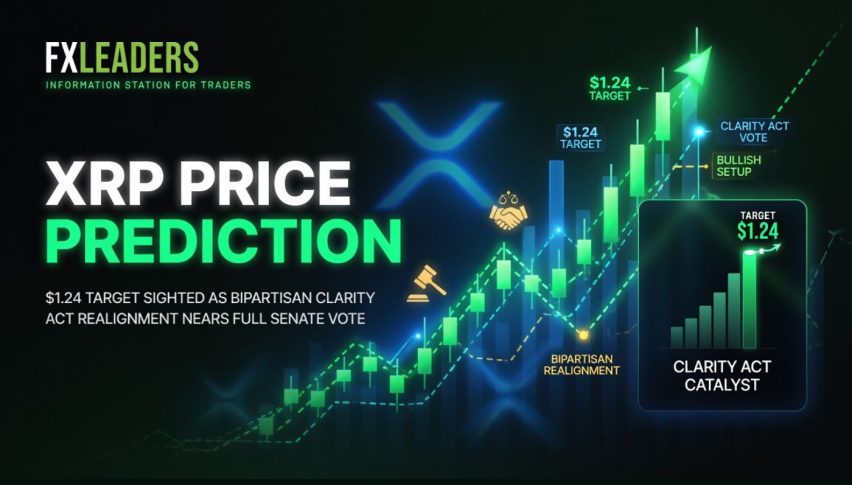
The future outlook for XRP remains mixed, with potential for recovery if market conditions improve. Current trends suggest that XRP may experience short-term fluctuations, with a possible price range of **$1.12 to $1.18** over the next month. In the longer term, the outlook could improve if XRP successfully navigates regulatory challenges and expands its market presence. Factors such as economic conditions, technological advancements, and regulatory developments will play a crucial role in shaping XRP’s price trajectory. Over the next 1 to 5 years, if XRP can establish itself as a leader in the cryptocurrency space, it could see significant appreciation. However, external factors such as market crashes or geopolitical issues could pose risks to its growth. Overall, while there are opportunities for XRP, investors should remain vigilant about potential challenges.
Technical Analysis
**Current Price Overview:** The current price of XRP is **$1.1451**, which is a decrease from the previous close of **$1.1851**. Over the last 24 hours, XRP has shown a bearish trend, with notable volatility as it fluctuated between **$1.12** and **$1.18**.
**Support and Resistance Levels:** Key support levels are at **$1.12**, **$1.10**, and **$1.07**, while resistance levels are at **$1.18**, **$1.21**, and **$1.23**. The pivot point is at **$1.16**, indicating that XRP is currently trading below this level, which may act as a resistance point.
**Technical Indicators Analysis:** The RSI is at **40.29**, suggesting a bearish trend. The ATR of **0.0543** indicates low volatility, while the ADX at **27.73** shows a strengthening trend. The 50-day SMA is at **1.1841**, and the 200-day EMA is at **1.3704**, indicating a bearish crossover.
**Market Sentiment & Outlook:** Sentiment is currently bearish, as indicated by the price action relative to the pivot point and the RSI direction. The ADX suggests a strengthening trend, but the overall market remains cautious.
Forecasting Returns: $1,000 Across Market Conditions
The table below outlines potential investment scenarios for XRP, providing insights into expected price changes and estimated values of a $1,000 investment after one month under different market conditions.
| Scenario | Price Change | Value After 1 Month |
|---|---|---|
| Bullish Breakout | +10% to ~$1.259 | ~$1,100 |
| Sideways Range | 0% to ~$1.145 | ~$1,000 |
| Bearish Dip | -10% to ~$1.031 | ~$900 |
FAQs
What are the predicted price forecasts for the asset?
The predicted daily closing price for XRP is **$1.1451**, with a range of **$1.12** to **$1.18**. For the weekly forecast, the expected closing price is **$1.15**, ranging from **$1.12** to **$1.21**.
What are the key support and resistance levels for the asset?
Key support levels for XRP are at **$1.12**, **$1.10**, and **$1.07**. Resistance levels are identified at **$1.18**, **$1.21**, and **$1.23**, with a pivot point at **$1.16**.
What are the main factors influencing the asset’s price?
XRP’s price is influenced by regulatory scrutiny, market sentiment, and economic data such as retail sales figures. Investor sentiment remains cautious as many await clearer regulatory guidance.
What is the outlook for the asset in the next 1 to 6 months?
In the short term, XRP may experience fluctuations within the range of **$1.12 to $1.18**. The long-term outlook will depend on regulatory developments and market dynamics.
What are the risks and challenges facing the asset?
XRP faces risks from competition, regulatory hurdles, and market volatility. These factors could impact its adoption and overall market performance.
Disclaimer
In conclusion, while the analysis provides a structured outlook on the asset’s potential price movements, it is essential to remember that financial markets are inherently unpredictable. Conducting thorough research and staying informed about market trends and economic indicators is crucial for making informed investment decisions.