Prices Forecast: Technical Analysis
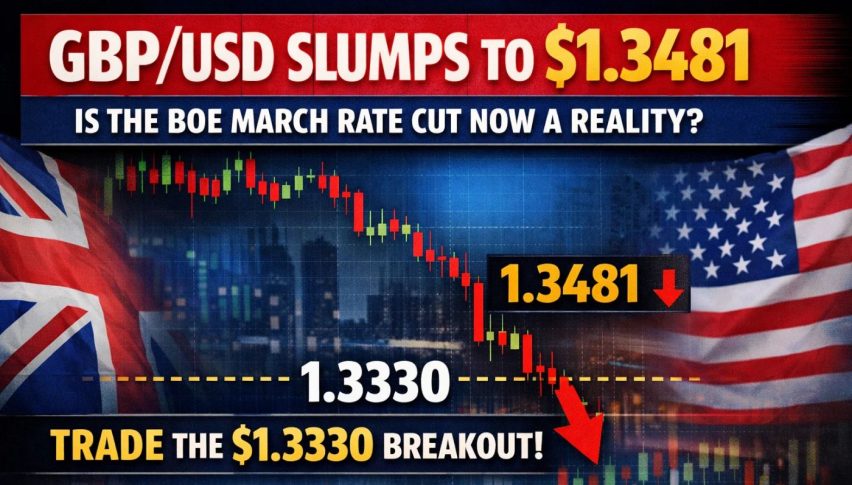
For the upcoming trading day, the predicted closing price for GBP/USD is 1.3480, with a range of 1.3450 to 1.3500. Over the week, we anticipate a closing price of 1.3500, with a range between 1.3450 and 1.3550. The technical indicators suggest a bearish sentiment, as the RSI is currently at 40.54, indicating that the market is approaching oversold territory. The ATR shows low volatility at 0.01, suggesting that price movements may be limited in the short term. The pivot point is at 1.3500, and since the current price is below this level, it reinforces the bearish outlook. Resistance levels at 1.3500 may act as a barrier to upward movement, while support at 1.3450 could provide a floor for prices. The market’s recent behavior shows a tendency to consolidate around these levels, which could lead to a breakout in either direction. Overall, traders should be cautious and watch for any significant news that could impact the GBP/USD pair.
Fundamental Overview and Analysis
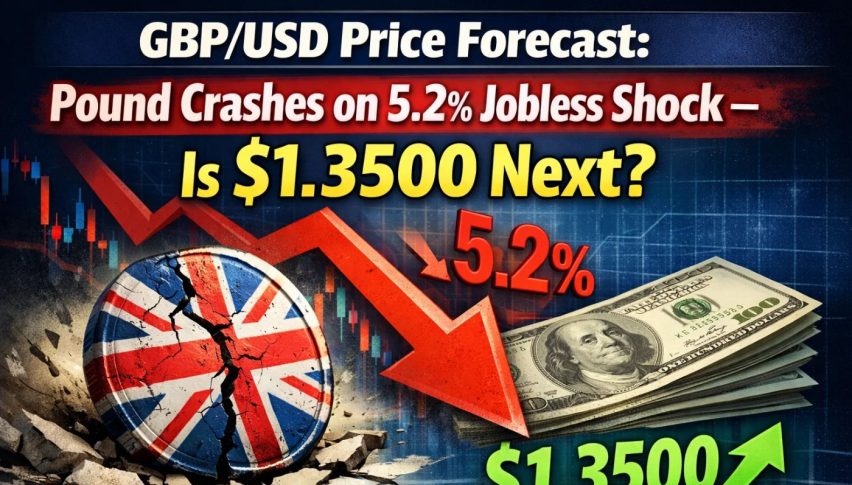
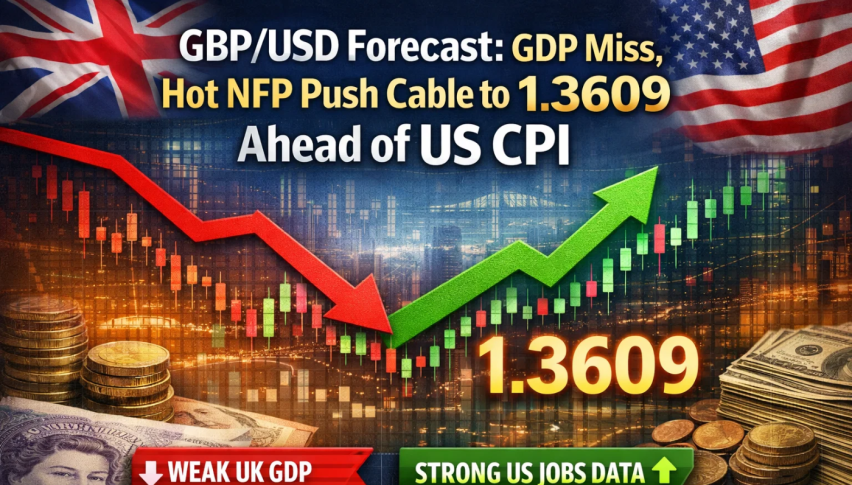
GBP/USD has recently shown a downward trend, influenced by macroeconomic factors such as interest rate decisions and economic data releases from the UK and the US. The demand for the pound has been affected by concerns over inflation and economic growth in the UK, while the US dollar remains strong due to its safe-haven status amid global uncertainties. Investor sentiment appears cautious, with many traders awaiting clearer signals from upcoming economic reports. Opportunities for growth exist if the UK economy shows signs of recovery, particularly in the labor market and consumer spending. However, risks include potential volatility from geopolitical tensions and changes in monetary policy. Currently, GBP/USD seems fairly valued, but any significant shifts in economic indicators could lead to reevaluation. Traders should remain vigilant and consider both technical and fundamental analyses when making investment decisions.
Outlook for GBP/USD
The future outlook for GBP/USD remains uncertain, with current trends suggesting a potential for further declines if bearish sentiment continues. Historical price movements indicate a consolidation phase, which could lead to a breakout in the coming weeks. Key factors influencing the price include economic conditions in the UK, particularly inflation rates and GDP growth, as well as the Federal Reserve’s monetary policy. In the short term (1 to 6 months), we could see prices range between 1.3400 and 1.3600, depending on economic data releases. Long-term forecasts (1 to 5 years) suggest that if the UK economy stabilizes, GBP/USD could recover towards 1.4000, but this is contingent on overcoming current challenges. External factors such as Brexit developments and global economic conditions will also play a crucial role in shaping the asset’s price trajectory.
Technical Analysis
Current Price Overview: The current price of GBP/USD is 1.3459, slightly down from the previous close of 1.3466. Over the last 24 hours, the price has shown a bearish trend with low volatility, indicating a lack of strong buying or selling pressure. Support and Resistance Levels: The identified support levels are 1.3450, 1.3400, and 1.3400, while resistance levels are at 1.3500, 1.3500, and 1.3500. The pivot point is at 1.3500, and since the price is trading below this level, it suggests a bearish sentiment. Technical Indicators Analysis: The RSI is at 40.54, indicating a bearish trend. The ATR is low at 0.01, suggesting limited volatility. The ADX is at 22.87, indicating a weak trend. The 50-day SMA is at 1.3467, and the 200-day EMA is not available, indicating no crossover currently. Market Sentiment & Outlook: Sentiment is currently bearish, as the price is below the pivot point, and the RSI indicates a lack of momentum for upward movement.
Forecasting Returns: $1,000 Across Market Conditions
The table below outlines potential investment scenarios for GBP/USD, providing insights into expected price changes and estimated returns on a $1,000 investment. Each scenario reflects different market conditions that could impact the asset’s performance.
| Scenario | Price Change | Value After 1 Month |
|---|---|---|
| Bullish Breakout | +5% to ~$1.418 | ~$1,050 |
| Sideways Range | 0% to ~$1.345 | ~$1,000 |
| Bearish Dip | -5% to ~$1.278 | ~$950 |
FAQs
What are the predicted price forecasts for the asset?
The predicted daily closing price for GBP/USD is 1.3480, with a range of 1.3450 to 1.3500. For the weekly forecast, the expected closing price is 1.3500, ranging from 1.3450 to 1.3550.
What are the key support and resistance levels for the asset?
Key support levels for GBP/USD are at 1.3450 and 1.3400, while resistance levels are at 1.3500. The pivot point is at 1.3500, indicating a bearish sentiment as the price is currently below this level.
What are the main factors influencing the asset’s price?
The asset’s price is influenced by macroeconomic factors such as inflation rates, GDP growth in the UK, and the Federal Reserve’s monetary policy. Additionally, geopolitical tensions and market sentiment play significant roles.
What is the outlook for the asset in the next 1 to 6 months?
In the short term, GBP/USD is expected to range between 1.3400 and 1.3600, depending on economic data releases. The outlook remains uncertain, with potential for further declines if bearish sentiment continues.
What are the risks and challenges facing the asset?
Risks include potential volatility from geopolitical tensions, changes in monetary policy, and economic instability in the UK. These factors could significantly impact GBP/USD’s price trajectory.
Disclaimer
In conclusion, while the analysis provides a structured outlook on the asset’s potential price movements, it is essential to remember that financial markets are inherently unpredictable. Conducting thorough research and staying informed about market trends and economic indicators is crucial for making informed investment decisions.