Prices Forecast: Technical Analysis
For GBP/USD, the predicted daily closing price is 1.3440, with a range of 1.3420 to 1.3460. The weekly closing price is forecasted at 1.3450, with a range of 1.3400 to 1.3500. The technical indicators suggest a neutral to slightly bullish sentiment, as the RSI is at 51.795, indicating that the market is neither overbought nor oversold. The ATR of 0.0077 suggests low volatility, which may lead to a more stable price movement within the predicted range. The price has been oscillating around the pivot point of 1.34, indicating indecision in the market. The support levels at 1.34 provide a solid base, while resistance at the same level suggests a potential barrier to upward movement. The recent price action shows a slight upward trend, supported by the SMA and EMA indicators, which are converging. Overall, the market sentiment appears cautiously optimistic, with potential for upward movement if the price breaks above the resistance levels.
Fundamental Overview and Analysis
GBP/USD has shown a mixed performance recently, with fluctuations driven by macroeconomic factors such as interest rate changes and geopolitical events. The demand for GBP is influenced by the UK’s economic recovery post-pandemic, while USD strength is tied to Federal Reserve policies. Investor sentiment remains cautious, with many traders watching for signs of inflation and economic growth. Opportunities for growth exist as the UK economy stabilizes, but risks include potential regulatory changes and market volatility. The current valuation of GBP/USD appears fairly priced, considering the recent price movements and economic indicators. Market participants are closely monitoring inflation data and employment figures, which could significantly impact future price movements. Overall, the balance of supply and demand, along with investor sentiment, will play a crucial role in determining the asset’s future trajectory.
Outlook for GBP/USD
The future outlook for GBP/USD remains cautiously optimistic, with potential for gradual appreciation in the coming months. Current market trends indicate a consolidation phase, with prices likely to remain within the established ranges unless significant economic data shifts sentiment. In the short term (1 to 6 months), we could see prices testing the upper resistance levels if economic indicators support a bullish narrative. Long-term forecasts (1 to 5 years) suggest that GBP/USD could appreciate further, driven by economic recovery and potential interest rate hikes in the UK. However, external factors such as geopolitical tensions and economic downturns could pose risks to this outlook. Traders should remain vigilant for any signs of market shifts that could impact price dynamics. Overall, the market appears to be in a wait-and-see mode, with potential for upward movement if key resistance levels are breached.
Technical Analysis
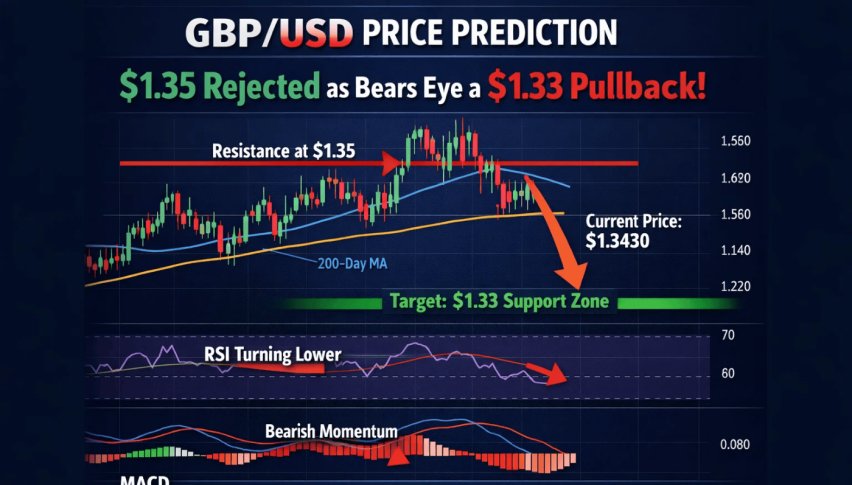
Current Price Overview: The current price of GBP/USD is 1.3439, slightly down from the previous close of 1.3444. Over the last 24 hours, the price has shown slight volatility, with a range between 1.3420 and 1.3460, indicating a stable trading environment. Support and Resistance Levels: The identified support levels are 1.3400, 1.3380, and 1.3350, while resistance levels are at 1.3460, 1.3480, and 1.3500. The pivot point is at 1.34, and the asset is currently trading just above this level, suggesting a bullish sentiment. Technical Indicators Analysis: The RSI is at 51.795, indicating a neutral trend. The ATR of 0.0077 suggests low volatility, while the ADX at 25.7648 indicates a strengthening trend. The 50-day SMA is at 1.3457, and the 200-day EMA is at 1.3395, showing no crossover but indicating a potential upward bias. Market Sentiment & Outlook: The current sentiment is slightly bullish, as the price is above the pivot point, supported by the RSI and ADX trends.
Forecasting Returns: $1,000 Across Market Conditions
The table below outlines potential investment scenarios for GBP/USD, providing insights into expected price changes and estimated returns on a $1,000 investment. Each scenario reflects different market conditions that could impact the asset’s performance.
| Scenario | Price Change | Value After 1 Month |
|---|---|---|
| Bullish Breakout | +5% to ~$1.411 | ~$1,050 |
| Sideways Range | 0% to ~$1.343 | ~$1,000 |
| Bearish Dip | -5% to ~$1.271 | ~$950 |
FAQs
What are the predicted price forecasts for the asset?
The predicted daily closing price for GBP/USD is 1.3440, with a range of 1.3420 to 1.3460. For the weekly forecast, the closing price is expected to be around 1.3450, ranging from 1.3400 to 1.3500.
What are the key support and resistance levels for the asset?
Key support levels for GBP/USD are at 1.3400, 1.3380, and 1.3350. Resistance levels are identified at 1.3460, 1.3480, and 1.3500, with the pivot point at 1.34.
What are the main factors influencing the asset’s price?
The asset’s price is influenced by macroeconomic factors such as interest rates, inflation data, and geopolitical events. Additionally, investor sentiment and market volatility play significant roles in price movements.
What is the outlook for the asset in the next 1 to 6 months?
The outlook for GBP/USD in the next 1 to 6 months is cautiously optimistic, with potential for gradual appreciation if economic indicators support a bullish narrative. However, external factors could pose risks to this outlook.
What are the risks and challenges facing the asset?
Risks include potential regulatory changes, market volatility, and geopolitical tensions that could impact investor sentiment. Additionally, economic downturns could pose challenges to the asset’s growth.
Disclaimer
In conclusion, while the analysis provides a structured outlook on the asset’s potential price movements, it is essential to remember that financial markets are inherently unpredictable. Conducting thorough research and staying informed about market trends and economic indicators is crucial for making informed investment decisions.