Prices Forecast: Technical Analysis
For the USD/CAD, the predicted daily closing price is 1.3688, with a range of 1.3670 to 1.3705. The weekly closing price is forecasted at 1.3700, with a range of 1.3660 to 1.3740. The technical indicators suggest a neutral trend, as the RSI is around 50, indicating neither overbought nor oversold conditions. The ATR shows low volatility, suggesting that price movements may be limited in the short term. The price has been oscillating around the pivot point of 1.3700, which is a critical level for traders. If the price holds above this level, it could indicate bullish momentum, while a drop below may signal bearish sentiment. The recent price action has shown a tendency to revert to the mean, as indicated by the Bollinger Bands. Overall, the market appears to be consolidating, and traders should watch for breakout opportunities.
Fundamental Overview and Analysis
The USD/CAD has recently shown a range-bound behavior, reflecting mixed market sentiment. Factors influencing its value include fluctuations in oil prices, as Canada is a major oil exporter, and U.S. economic data releases. Investor sentiment appears cautious, with many awaiting clearer signals from economic indicators. The potential for growth remains, particularly if oil prices rise, which could strengthen the Canadian dollar. However, risks include ongoing geopolitical tensions and potential regulatory changes affecting trade. Currently, the asset seems fairly priced, with no significant overvaluation or undervaluation evident. Market participants are closely monitoring the economic calendar for any impactful news that could sway prices.
Outlook for USD/CAD
The future outlook for USD/CAD suggests a cautious approach, with potential for slight upward movement in the short term. Current market trends indicate a consolidation phase, with prices likely to remain within the established range. In the next 1 to 6 months, economic conditions, particularly in the U.S. and Canada, will play a crucial role in price movements. Long-term forecasts suggest that if oil prices stabilize or increase, the CAD could strengthen against the USD. However, external factors such as geopolitical events or economic downturns could pose risks. Overall, the market appears to be in a wait-and-see mode, with traders advised to remain vigilant for any significant changes.
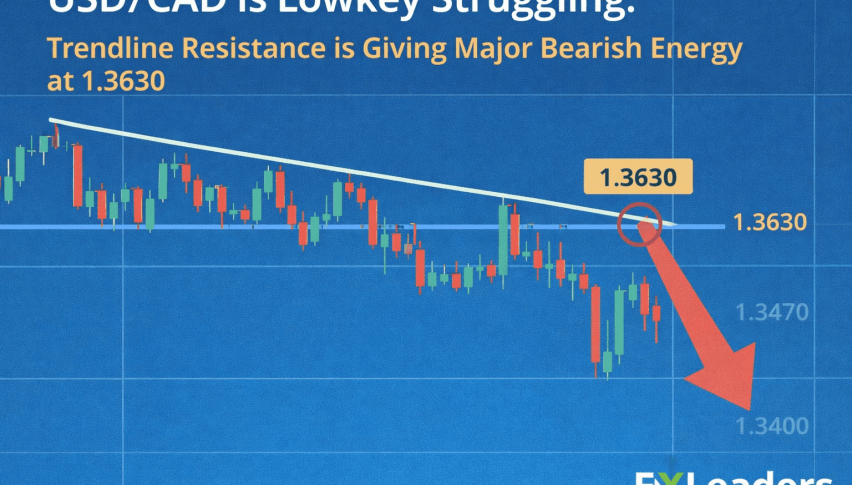
Technical Analysis
Current Price Overview: The current price of USD/CAD is 1.3688, slightly down from the previous close of 1.3700. Over the last 24 hours, the price has shown limited volatility, trading within a narrow range. Support and Resistance Levels: Key support levels are at 1.3670, 1.3660, and 1.3650, while resistance levels are at 1.3705, 1.3710, and 1.3720. The pivot point is at 1.3700, and the asset is currently trading below this level, indicating potential bearish sentiment. Technical Indicators Analysis: The RSI is at 50.94, suggesting a neutral trend. The ATR is low at 0.0077, indicating low volatility. The ADX is at 22.75, suggesting a weak trend. The 50-day SMA is at 1.3962, and the 200-day EMA is not available, indicating no crossover currently. Market Sentiment & Outlook: Sentiment appears neutral, with price action hovering around the pivot point. The RSI and ADX indicate a lack of strong momentum, and traders should be cautious of potential breakouts.
Forecasting Returns: $1,000 Across Market Conditions
The table below outlines potential investment scenarios for USD/CAD, providing insights into expected returns based on different market conditions.
| Scenario | Price Change | Value After 1 Month |
|---|---|---|
| Bullish Breakout | +5% to ~$1.4373 | ~$1,050 |
| Sideways Range | 0% to ~$1.3688 | ~$1,000 |
| Bearish Dip | -5% to ~$1.2993 | ~$950 |
FAQs
What are the predicted price forecasts for the asset?
The predicted daily closing price for USD/CAD is 1.3688, with a range of 1.3670 to 1.3705. For the weekly forecast, the closing price is expected to be around 1.3700, within a range of 1.3660 to 1.3740.
What are the key support and resistance levels for the asset?
Key support levels for USD/CAD are at 1.3670, 1.3660, and 1.3650. Resistance levels are identified at 1.3705, 1.3710, and 1.3720, with the pivot point at 1.3700.
What are the main factors influencing the asset’s price?
The asset’s price is influenced by fluctuations in oil prices, U.S. economic data releases, and overall market sentiment. Investor behavior and geopolitical events also play significant roles.
What is the outlook for the asset in the next 1 to 6 months?
The outlook for USD/CAD suggests a cautious approach, with potential for slight upward movement if economic conditions improve. However, external factors could pose risks to this forecast.
What are the risks and challenges facing the asset?
Risks include ongoing geopolitical tensions, potential regulatory changes, and market volatility. These factors could impact investor sentiment and price movements significantly.
Disclaimer
In conclusion, while the analysis provides a structured outlook on the asset’s potential price movements, it is essential to remember that financial markets are inherently unpredictable. Conducting thorough research and staying informed about market trends and economic indicators is crucial for making informed investment decisions.